 2016, Vol. 40


2 中国科学院大学, 北京 100049
2 Graduate University of Chinese Academy of Sciences, Beijing 100049
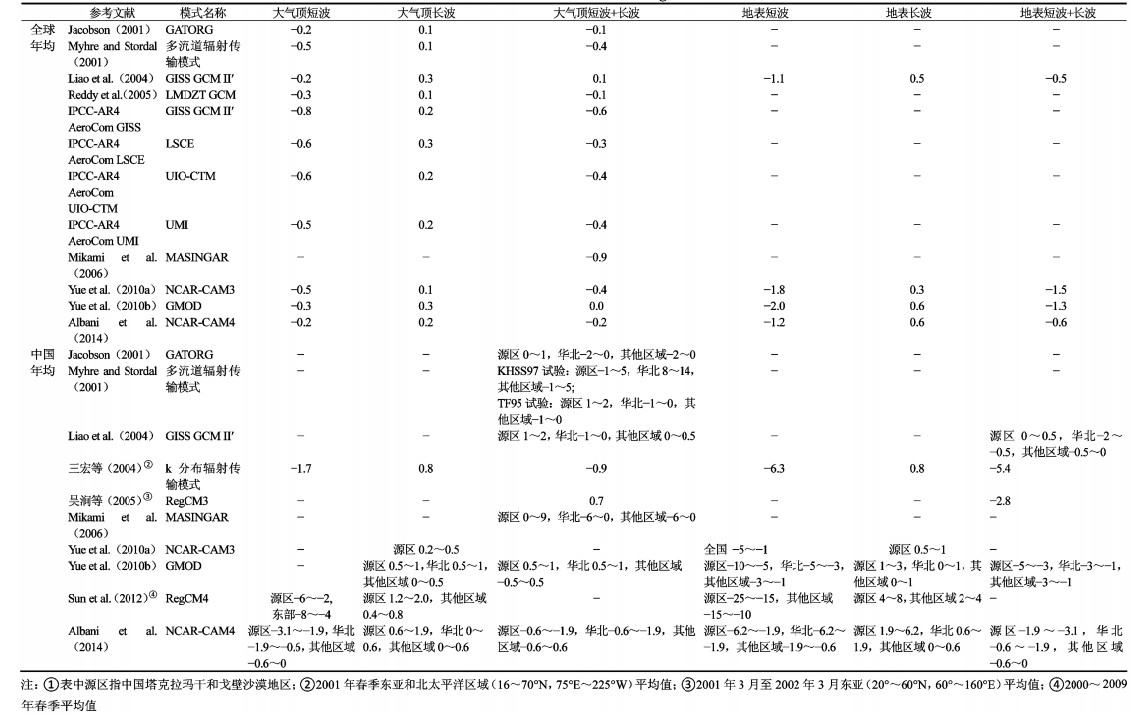
沙尘气溶胶通过吸收和散射太阳短波辐射和地表红外辐射影响气候(Huang et al., 2006; Mikami et al., 2006; Yue et al., 2010a),直接辐射强迫值是对这种影响的定量表达。研究表明(表 1),全球年均沙尘气溶胶在大气顶的总直接辐射强迫(短波+长波)为−0.9~0.1 W m−2(Jacobson, 2001; Myhre and Stordal, 2001; Liao et al., 2004; Reddy et al., 2005; Mikami et al., 2006; Yue et al., 2010a, 2010b; Albani et al., 2014),地表强迫为−1.5~−0.5 W m−2(Liao et al., 2004; Yue et al., 2010a, 2010b; Albani et al., 2014),具有很大的不确定性。
我国西北是东亚重要的沙尘源区,表 1总结了文献中估算的该区域沙尘气溶胶直接辐射强迫。一些研究得到了该区域春季的值。比如,基于Gong et al.(2003)利用NARCM (Northern Aerosol Regional Climate Model)模式模拟的2001年春季东亚和北太平洋区域(16°~70°N,75°E~225°W)沙尘气溶胶浓度,王宏等(2004)利用k分布辐射传输模式计算了其间区域平均沙尘气溶胶大气顶总辐射强迫为−0.9 W m−2,其中短波和长波辐射强迫分别为−1.7 W m−2和0.8 W m−2;地面总辐射强迫为−5.4 W m−2,其中短波和长波辐射强迫分别为−6.3 W m−2和0.8 W m−2。Sun et al.(2012)利用RegCM4(Regional Climate Model version 4)模拟了2000~2009年中国沙尘春季晴空辐射强迫,显示大气顶短波辐射强迫在塔克拉玛干和戈壁沙漠沙尘源区为−6.0~−2.0 W m−2,在中国东部为−8.0~−4.0 W m−2;大气顶长波辐射强迫在源区为1.2~2.0 W m−2,中国其他区域为0.4~0.8 W m−2。地面短波辐射强迫在源区为−25.0~−15.0 W m−2,中国其他区域为−15.0~−10.0 W m−2;地面长波辐射强迫在源区为4.0~8.0 W m−2,中国其他区域为2.0~4.0 W m−2。
另外一些研究报道了中国沙尘气溶胶直接辐射强迫的年均值。沙尘气溶胶大气顶总辐射强迫在塔克拉玛干和戈壁沙漠为−1.9~9 W m−2,华北为−6.3~−1 W m−2,中国其他区域为−6~−0.6 W m−2(Jacobson, 2001; Myhre and Stordal, 2001; Liao et al., 2004; Mikami et al., 2006; Yue et al., 2010b; Albani et al., 2014)。地表总辐射强迫在中国源区为−15~0.5 W m−2,华北为−10~−0.5 W m−2,中国其他区域为−5~0.6 W m−2(Liao et al., 2004; Yue et al., 2010b; Albani et al., 2014)。可见,由于模式选择沙尘光学特性的不同,沙尘在中国源区辐射强迫的正、负号也不确定。此外,吴涧等(2005)利用RegCM3得到了2001年3月~2002年3月东亚(20°~60°N,60°~160°E)沙尘气溶胶大气顶和地表年均总直接辐射强迫分别为0.7 W m−2和−2.8 W m−2。综上所述,上述研究均基于单个数值模拟结果,观测或模拟沙尘浓度以及辐射传输方案存在显著差异,使得辐射强迫估算有很大不确定性。
本文旨在评估我区域沙尘气溶胶直接辐射强迫的多模式不确定性。研究基于国际大气化学-气候模式比较计划(Atmospheric Chemistry and Climate Model Intercomparison Project,ACCMIP)(Lamarque et al., 2013b)的多模式模拟结果。ACCMIP模式模拟结果被政府间气候变化委员会第五次报告(Intergovernmental Panel on Climate Change Fifth Assessment Report,IPCC-AR5)广泛采用,其宗旨在于评估大气短寿命辐射成分(如气溶胶、臭氧、甲烷等)及其化学过程在当前气候模式中的模拟水平。目前,已有许多研究对ACCMIP多模式模拟的不同时期(1750~2100年)的臭氧(Bowman et al., 2013; Stevenson et al., 2013; Young et al., 2013)、羟基自由基与甲烷(Naik et al., 2013; Voulgarakis et al., 2013)、黑碳(Lee et al., 2013)和氮硫元素(Lamarque et al., 2013a)的时空变化和辐射强迫进行了评估,但利用ACCMIP多模式对中国区域沙尘浓度和辐射强迫的研究仍然缺乏。
| 表 1 文献报道的全球和中国平均沙尘气溶胶辐射强迫(单位:Wm-2) Table 1 Global China mean dust radiative forcing(units:Wm-2) |
ACCMIP包含不同的大气环流模式,分别耦合不同的化学模块。其中7个模式模拟了沙尘气溶胶浓度,分别是GFDL-AM3(Geophysical Fluid Dynamics Laboratory Atmospheric Model version 3)、GISS-E2-R (Goddard Institute for Space Studies General Circulation Model)、GISS-TOMAS (Implemented TwO-Moment Aerosol Sectional aerosol microphysics mode into GISS-E2-R)、HadGEM2(Hadley Centre Global Environmental Model version 2)、MIROC-CHEM (atmospheric chemistry coupled version of Model for Interdisciplinary Research on Climate)、NCAR-CAM3.5(National Center for Atmospheric Research Community Atmosphere Model version 3.5)和NCAR-CAM5.1(National Center for Atmospheric Research Community Atmosphere Model version 5.1)。所有模拟试验使用再分析资料海温,大气环流与气溶胶辐射在线双向耦合。气候模式采用参数化起沙方案,即根据地表下垫面类型和地表风场在线计算起沙量,但各ACCMIP模式使用的参数化方案略有不同。本文使用的ACCMIP模式基本参数见表 2,模式详细描述见Lamarque et al.(2013b)。ACCMIP模拟数据来自https://badc.nerc.ac.uk [2015-05-01]。
2.2 沙尘辐射强迫的计算沙尘气溶胶辐射强迫是根据有无沙尘情形试验辐射强迫的差值计算得到,即有无沙尘对地气系统辐射通量的影响。由于并不是所有ACCMIP模式都直接输出了沙尘辐射强迫值,本文采用各ACCMIP模式模拟的气溶胶质量浓度,统一使用GISS GCM II′(Goddard Institute for Space Studies General Circulation Model II′)大气环流模式的辐射传输方案计算沙尘直接辐射强迫。此外,由于ACCMIP模式只提供了沙尘气溶胶的总浓度,并未提供各粒径段浓度,因此我们根据GISS GCM II′的2000年参照试验中沙尘各粒径段的浓度比例,将ACCMIP模式的沙尘浓度分配到GISS GCM II′的粒径段中,并保持总浓度不变。GISS GCM II′模式采用单高斯点倍加-累加辐射传输方案(Lacis and Hansen, 1974; Hansen et al., 1983),计算6个短波和25个长波波段的辐射通量。气溶胶光学特性(消光系数、散射系数和不对称因子)根据米散射理论,基于沙尘粒子的谱分布和复折射指数计算得到。沙尘粒子从0.0316~31.6 µm分为6个档(0.0316~0.1、0.1~0.316、0.316~1.0、1.0~3.16、3.16~10和10~31.6 µm)。各波段沙尘气溶胶光学参数参见Liao et al.(2004),其中550 nm中国地区沙尘气溶胶年均单次散射反照率(Single Scattering Albedo,SSA)如图 1所示。西北沙漠地区SSA值在0.872~0.878范围内,与Huang et al.(2009)报道670 nm的值0.89相当。模式中每个积分步长的地表反照率是根据气象和地表参数变化计算得出(Hansen et al., 1983)。陆地的反照率是植被类型的函数,随波段和季节变化。当有降雪的时候,地表反照率根据积雪厚度、沉积时间、植被覆盖量和无雪地面反照率计算。陆冰在可见光波段和近红外波段反照率分别为0.60和0.31。塔克拉玛干沙漠的全波段中国年均地表反照率在0.2~0.25之间,与Aoki et al.(2005)于2002年4月4日在塔里木盆地观测的值0.273相当。GISS-E2-R模式和本文中GISS GCM II′模式为同一个动力框架下的不同版本,通过对比ACCMIP提供的和本文计算的GISS-E2-R模式沙尘气溶胶大气顶短波和长波辐射强迫,发现它们模拟的辐射强迫空间分布和量值接近,中国平均沙尘大气顶短波和长波辐射强迫差异均小于0.3 W m−2,总辐射强迫相当(图未显示),说明本文的GISS GCM II′模式有较好的合理性和可靠性。由于IPCC-AR5只报道了人为沙尘气溶胶的辐射强迫,所以本文的结果主要IPCC-AR4中的值相比较。Liao et al.(2004)利用此辐射传输方案计算的全球平均沙尘气溶胶大气顶和地表辐射强迫分别为0.1 W m−2和−0.5 W m−2,处于IPCC-AR4合理范围内,说明本文使用的辐射传输方案具有很好的代表性。

|
图 1 GISS GCM II′(Goddard Institute for Space Studies General Circulation Model II′)模拟的550 nm沙尘气溶胶年均单次散射反照率(SSA),右上角为中国平均值 Figure 1 SSA (Single Scattering Albedo) of dust aerosol at 550 nm simulated by GISS GCM II' (Goddard Institute for Space Studies General Circulation Model II'). The averaged value over China is given at the top right corner of the panel |
| 表 2 国际大气化学-气候模式比较计划(ACCMIP)中有沙尘模拟的各模式基本信息 Table 2 ACCMIP (Atmospheric Chemistry and Climate Model Intercomparison Project) models with dust simulation |
本文利用中国气象局大气观测网(Chinese Meteorological Administration Atmosphere Watch Network,CAWNET)于2006~2007年在全国14个站点观测的月平均沙尘地表浓度(Zhang et al., 2012)来评估ACCMIP模式模拟的结果。其中敦煌站点地处西北沙尘源区。所有站点观测的沙尘浓度是PM10中沙尘的浓度,跟大多数模式的粒径范围一致。
由于沙尘气溶胶光学厚度(Aerosol Optical Depth,AOD)在中国西北总气溶胶AOD中占主导地位,我们利用MISR (Multi-angle Imaging SpectroRadiometer)卫星观测的2000~2010年中国西北地区555 nm总气溶胶AOD来评估GISS GCM II′模拟的550 nm沙尘气溶胶AOD。
3 ACCMIP模拟的中国区域沙尘排放和浓度 3.1 沙尘排放图 2显示了7个ACCMIP模式模拟的中国地区沙尘年排放通量。中国沙尘源区主要集中在西北沙漠地区。总体来说,大多数模式均模拟出内蒙西部的戈壁沙漠和新疆塔克拉玛干沙漠的强起沙源区,但各模式有显著差异。例如HadGEM2模式不能再现塔克拉玛干沙漠源区,而MIROC、CAM3.5和CAM5.1模拟的塔克拉玛干沙漠沙源位置偏东。不同模式的起沙通量也有很大差异。其中,GFDL模拟的最大起沙通量仅为40~50×10−10 kg m−2 s−1,而CAM5.1模拟的最大起沙通量则高达400~850× 10−10 kg m−2 s−1。7个ACCMIP模式模拟的中国沙尘年排放总量的变化范围是67(GISS-TOMAS)~510(CAM5.1) Tg a−1,平均值为215±163 Tg a−1,说明ACCMIP中气候模式模拟的沙尘排放有很大不确定性。这是由于各模式在线模拟的气象场和起沙方案的不同造成的。

|
图 2 各模式模拟的沙尘年排放通量(单位:10−10 kg m−2 s−1),每图右上角为中国年排放总量(单位:Tg a−1) Figure 2 Annual mean emission flux (units: 10−10 kg m−2 s−1) of dust simulated by each ACCMIP model. Annual emission (units: Tg a−1) over China is given at the top right corner of each panel |
图 3显示了各模式模拟的中国地区沙尘年平均地表浓度。所有模式合理模拟出中国西北地区的地表沙尘高浓度,年均值为15~200 µg m−3。大多数模式模拟的源区浓度为200~500 µg m−3,但CAM3.5和CAM5.1模拟的源区浓度相对较高,其中CAM5.1模拟最大值达到2500 µg m−3。CAM5.1模拟的中国平均沙尘年均地表浓度最大,为89 µg m−3,而MIROCss模拟的值最小,仅为21 µg m−3,7个ACCMIP模式的平均值为41±27 µg m−3。

|
图 3 各模式模拟的年平均沙尘地表浓度(单位:µg m−3),每图右上角为中国平均值 Figure 3 Annual mean surface-layer concentrations (units: µg m−3) of dust simulated by each ACCMIP model. The averaged concentration over China is given at the top right corner of each panel |
图 4对比了CAWNET站点(图 4h)观测和7个ACCMIP模式模拟的月平均地表沙尘浓度,结果表明,GFDL、GISS、GISS-TOMAS、HadGEM2和MIROC模拟的沙尘地表浓度显著低于观测值,平均偏低65.3%~78.6%。CAM3.5模拟值低估较小,平均偏低12.3%。而CAM5.1相对于观测值高估了6.6%。此外,GFDL、GISS、GISS-TOMAS和CAM3.5模拟的月均沙尘浓度和观测的相关性较好,相关系数在0.42~0.57之间,说明这些模式基本能够模拟出中国沙尘地表浓度的季节变化。其他3个模式(HadGEM2、MIROC和CAM5.1)较差,其中MIROC模拟和观测之间的相关系数仅为0.14。综合7个模式的表现,与观测相比,CAM3.5模拟的中国地区沙尘地表浓度最好,而MIROC模式最差。

|
图 4 在14个中国气象局大气观测网(CAWNET)站点,(a-g)观测(x轴)和模拟(y轴)的各模式月平均地表沙尘浓度(单位:µg m−3)的对比(实斜线为1:1比例线,虚斜线为2:1和1:2比例线)。(h) 14个CAWNET站点位置,分别为成都(CD,30°39'N,104°2.4'E)、敦煌(DH,40°9'N,94°40.8'E)、大连(DL, 38°54'N,121°37.8'E)、顾城(GC,39°7.8'N,115°48'E)、皋兰山(GLS,36°0'N,105°51'E)、金沙(JS,29°37.8'N,114°12'E)、临安(LA,30°18'N,119°44'E)、龙凤山(LFS,44°43.8'N,127°36'E)、拉萨(LS,29°40.2'N,91°7.8'E)、南宁(NN,22°49.2'N,108°21'E)、番禺(PY,23°0'N,113°21'E)、太阳山(TYS,29°10.2'N,111°42.6'E)、西安(XA,34°25.8'N,108°58.2'E)和郑州(ZZ,34°46.8'N,113°40.8'E) Figure 4 (a-g) Comparisons of observed (x axis) and simulated (y axis) monthly mean surface-layer concentrations (units: µg m−3) of dust at 14 CAWNET (Chinese Meteorological Administration Atmosphere Watch Network) sites for each ACCMIP model (solid lines indicate 1:1 ratio, and dashed lines indicate 2:1 and 1:2 ratios). The 14 CAWNET sites shown in (h) include Chengdu (CD, 30°39'N, 104°2.4'E), Dunhuang (DH, 40°9'N, 94°40.8'E), Dalian (DL, 38°54'N, 121°37.8'E), Gucheng (GC, 39°7.8'N, 115°48'E), Gaolanshan (GLS, 36°0'N, 105°51'E), Jinsha (JS, 29°37.8'N, 114°12'E), Lin'an (LA, 30°18'N, 119°44'E), Longfengshan (LFS, 44°43.8'N, 127°36'E), Lasa (LS, 29°40.2'N, 91°7.8'E), Nanning (NN, 22°49.2'N, 108°21'E), Panyu (PY, 23°0'N, 113°21'E), Taiyangshan (TYS, 29°10.2'N, 111°42.6'E), Xi'an (XA, 34°25.8'N, 108°58.2'E), and Zhengzhou (ZZ, 34°46.8'N, 113°40.8'E) |
图 5显示了各模式模拟的中国地区沙尘年均柱浓度。柱浓度的空间分布与地表浓度相似(图 3)。大多数模式模拟的最大沙尘柱浓度位于塔克拉玛干沙漠,达到20~50 kg m−2,其中CAM3.5和CAM5.1模拟的最大值相对偏高,分别为50~100和150~300 kg m−2。与其他模式不同,HadGEM2模拟的最大值位于戈壁地区,为20~50 kg m−2。7个模式模拟的中国平均柱浓度大小顺序与年排放总量的大小顺序类似,CAM5.1模拟的中国平均柱浓度最大(15 kg m−2),GFDL最小(6 kg m−2),7个模式的平均值为9±4 kg m−2。值得注意的是,MIROC和HadGEM2模式模拟的年排放总量和柱浓度在所有模式中较高,而地表浓度较低,说明这两个模式中除排放以外垂直输送对模拟的沙尘地表浓度影响很大。

|
图 5 各模式模拟的沙尘年平均柱浓度(单位:kg m−2),每图右上角为中国平均值 Figure 5 Annual mean burden (units: kg m−2) of dust simulated by each ACCMIP model. The averaged value over China is shown at the top right corner of each panel |
利用各ACCMIP模式模拟的气溶胶质量浓度,统一使用GISS GCM II′模式模拟的沙尘AOD如图 6a-g所示。其空间分布与沙尘柱浓度的空间分布相似。大多数模式模拟的中国西北沙尘AOD在0.05~0.3范围内,最大值出现在塔克拉玛干沙漠或内蒙西部,值在0.1~0.3之间。而CAM3.5和CAM5.1模拟值相对偏高,最大值分别为0.4~0.5和0.7~0.8。7个模式模拟的中国年均沙尘AOD在0.05 (GFDL)~0.18(CAM5.1)范围内,平均值为0.09±0.05。

|
图 6 (a-g)各模式模拟的550 nm沙尘年均气溶胶光学厚度(AOD)和(h)MISR(Multi-angle Imaging SpectroRadiometer)卫星观测的2000~2010年年均555 nm总AOD。每图右上角值为中国平均值。(h)中黑色虚线区域(36°N以北和110°E以西的中国区域)为沙尘高浓度区 Figure 6 (a-g) Annual mean AOD (Aerosol Optical Depth) of dust at 550 nm simulated by each ACCMIP model and (h) observed annual mean AOD of total aerosols at 555 nm over 2000-2010 retrieved from MISR (Multi-angle Imaging SpectroRadiometer). The averaged value over China is given at the top right corner of each panel. The region with high dust concentrations in China (to the north of 36°N and west of 110°E) is denoted by black lines in (h) |
我们利用图 6h所示的MISR卫星观测的2000~2010年年均中国555 nm总AOD来评估各模式模拟的沙尘AOD。为减少沙尘以外其他气溶胶的影响,我们仅评估中国西北沙尘高浓度区域(36°N以北和110°E以西的中国区域)的情况。中国西北MISR卫星观测的总AOD在0.1~0.5范围内,最大值出现在塔克拉玛干沙漠地区,值为0.4~0.5,区域平均值为0.24。GFDL、GISS、GISS-TOMAS、HadGEM2和MIROC模拟的沙尘AOD在中国西北的平均值为0.10~0.14,相对观测值平均偏低42%~58%。CAM3.5和CAM5.1模拟的沙尘AOD在中国西北的平均值分别为0.31和0.44,相对观测值平均偏高27%和80%。
4.2 大气顶辐射强迫图 7显示了各模式模拟的中国沙尘气溶胶年均大气顶短波辐射强迫。可以看出,模拟的大气顶短波辐射强迫的空间分布和柱浓度的空间分布类似。整体而言,除了青藏高原和青海以外的其他中国地区,所有模式模拟沙尘气溶胶对短波在大气顶产生负强迫,沙尘浓度越高负强迫越大,这和Albani et al.(2014)利用CAM4(Community Atmosphere Model version 4)模拟的中国情况相同。在青藏高原和青海地区,沙尘产生正强迫,值为0.0~0.3 W m−2。GFDL、GISS、GISS-TOMAS和MIROC模拟的最小值位于塔克拉玛干沙漠,为−5.0~−2.0 W m−2,在其他西北地区值为−2.0~−1.0 W m−2。在中国中部、南部和东北部地区的值分别为−2.0~−0.5 W m−2,−1.0~−0.5 W m−2和−1.0~0.0 W m−2。CAM3.5和CAM5.1模拟的最小值也位于塔克拉玛干沙漠,但负强迫更大,为−15.0~−5.0 W m−2。此外,它们模拟的中国北部的值为−5.0~−2.0 W m−2,南部和东北部的值为−2.0~0.0 W m−2。然而,HadGEM2模拟的最小值位于戈壁,值为−5.0~−15.0 W m−2,在中国中部、南部和东北部的值分别为−2.0~−0.5 W m−2,−5.0~−2.0 W m−2和−1.0~−0.5 W m−2。各模式模拟的中国平均大气顶短波辐射强迫与柱浓度呈线性关系,CAM5.1的模拟值最大(−2.5 W m−2),GFDL的模拟值最小(−0.6 W m−2)。表 3总结了各模式模拟的中国和全球平均辐射强迫值。7个ACCMIP模式模拟的中国大气顶短波辐射强迫的平均值为−1.3±0.8 W m−2,强于全球平均值−0.9±0.5 W m−2和IPCC-AR4(2007)报道的范围−0.2~−0.8 W m−2。

|
图 7 各模式模拟的沙尘气溶胶大气顶短波辐射强迫(单位:W m−2),每图右上角为中国平均值 Figure 7 Annual mean short-wave direct radiative forcing (units: W m−2) by dust at the top of the atmosphere in each ACCMIP model. The averaged value over China is given at the top right corner of each panel |
| 表 3 各模式模拟的沙尘气溶胶全球和中国平均各辐射强迫(单位:W m−2) Table 3 Global and China mean radiative forcing (units: W m−2) by dust in each ACCMIP model |
各模式模拟的中国沙尘气溶胶年均大气顶长波辐射强迫如图 8所示。模拟的大气顶长波辐射强迫的空间分布也和柱浓度的空间分布类似。所有模式模拟的中国沙尘气溶胶对长波在大气顶产生正强迫,浓度越高正强迫越大,从中国西北至东南逐渐降低。所有模式模拟的最大值均出现在塔克拉玛GISS和GISS-TOMAS模拟的最大值为1.0~1.5 W m−2,HadGEM2、MIROC、CAM3.5和CAM5.1模拟的最大值为2.0~5.0 W m−2。大多数模式模拟的值均由西北至东南逐渐降低至0.2~0.4 W m−2,而HadGEM2模拟的值在中国东部相对其他模式较大,为1.0~1.5 W m−2。和表 1中文献报道的值对比发现,GFDL、GISS和GISS-TOMAS模拟源区的值与文献报道源区的值0.2~1.9 W m−2(Yue et al., 2010a, 2010b; Albani et al., 2014)相当,其他模式均偏大。但是,各模式在中国东南的值均和文献报道的0~0.7 W m−2接近。7个ACCMIP模式模拟的中国平均值在0.3(GFDL)~1.3(HadGEM2) W m−2范围内,平均值为0.7±0.3 W m−2;全球平均值较小为0.4±0.3 W m−2,比IPCC-AR4(2007)报道的范围0.07~0.3 W m−2略大。值得注意的是,虽然HadGEM2模拟的中国平均柱浓度在7个模式中居中,却产生了最大的大气顶长波辐射强迫。从图 9各模式模拟沙尘浓度的垂直分布中可以看出,这是由于HadGEM2模式模拟的高层沙尘气溶胶浓度相对于其他模式较高,说明大气顶长波辐射强迫不仅和气溶胶的柱浓度有关,还与气溶胶的垂直分布密切相关。

|
图 8 各模式模拟的沙尘气溶胶大气顶长波辐射强迫(单位:W m−2),每图右上角为中国平均值 Figure 8 Simulated annual mean long-wave direct radiative forcing (units: W m−2) by dust at the top of the atmosphere in each ACCMIP model. The averaged value over China is given at the top right corner of each panel |

|
图 9 各模式模拟的中国年平均沙尘浓度(单位:10−8 kg kg−1)的垂直分布 Figure 9 Vertical distributions of annual mean dust concentrations (units: 10−8 kg kg−1) averaged over China simulated by each ACCMIP model |
综上所述,7个ACCMIP模式模拟的中国沙尘气溶胶大气顶总辐射强迫(短波+长波)平均值为−0.5±0.7 W m−2(表 3),说明沙尘气溶胶在中国大气顶起降温作用。该值与王宏等(2004)模拟的东亚和北太平洋区域2001年春季平均值−0.9 W m−2符号相同,但负强迫略小。与Chang and Liao (2009)计算的1850~2000年中国硝酸盐(−0.8 W m−2)和黑碳(0.6 W m−2)气溶胶的辐射强迫在数值上相当。此外,7个ACCMIP模式模拟的全球大气顶总辐射强迫平均值为−0.5±0.2 W m−2,和IPCC-AR5(2013)报道的1750~2010年硫酸盐(−0.4 W m−2)和黑碳(0.4 W m−2)气溶胶的辐射强迫在数值上相当。这说明在研究气溶胶对全球或中国气候的影响时,除了人为气溶胶之外,自然沙尘气溶胶的作用也不容忽视。
4.3 地表辐射强迫图 10显示了各模式模拟的中国沙尘气溶胶年均地表短波辐射强迫。各模式模拟的沙尘地表短波辐射强迫的大小和空间分布与大气顶短波辐射强迫的情况类似。不同的是,在青藏高原大部分地区沙尘在地表模拟出负强迫,值为−0.5~0.0 W m−2,只有GFDL、GISS和GISS-TOMAS模式在青海南部模拟出弱正强迫,值为0.0~0.3 W m−2。7个ACCMIP模式模拟的中国平均值在−3.1(CAM5.1)~−0.8(GFDL) W m−2范围内,平均值为−1.5±1.0 W m−2,比大气顶的负强迫略大;全球平均值为−1.0±0.5 W m−2,小于文献报道的范围−2.0~−1.1 W m−2(Liao et al., 2004; Yue et al., 2010a, 2010b)。

|
图 10 各模式模拟的沙尘气溶胶地表短波辐射强迫(单位:W m−2),每图右上角为中国平均值 Figure 10 Annual mean surface short-wave direct radiative forcing (units: W m−2) by dust simulated in each ACCMIP model. The averaged value over China is shown at the top right corner of each panel |
图 11显示了各模式模拟的中国沙尘气溶胶年均地表长波辐射强迫。与大气顶长波辐射的情况类似,在地表,沙尘也产生正强迫,浓度越高正强迫越大,从中国西北至东南逐渐降低。但是地表长波辐射强迫的值却比大气顶的辐射强迫大。GFDL、GISS、GISS-TOMAS、HadGEM2和MIROC模拟的值在中国西北大部分地区为2.0~5.0 W m−2,大多数模式的最大值达到5.0~20.0 W m−2,在中国东南的值为0.2~0.4 W m−2。CAM3.5和CAM5.1模拟西北大部分地区的值相对较大,为5.0~20.0 W m−2。中国平均而言,各模式模拟的地表长波辐射强迫与地表浓度大体上呈线性关系,CAM5.1模拟值最大(3.2 W m−2),HadGEM2模拟值最小(1.1 W m−2)。7个模式的中国平均值为1.8±0.9 W m−2,全球平均值为0.6±0.2 W m−2,后者处于文献报道的0.3~0.6 W m−2范围内(Liao et al., 2004; Yue et al., 2010a, 2010b)。

|
图 11 各模式模拟的中国沙尘气溶胶地表长波辐射强迫(单位:W m−2),每图右上角为中国平均值 Figure 11 Annual mean surface long-wave direct radiative forcing (units: W m−2) by dust simulated in each ACCMIP model. The averaged value over China is given at the top right corner of each panel |
综上所述,由于7个ACCMIP模式模拟的中国沙尘气溶胶在地表对长波表现出了很强的吸收,导致模拟的中国地表总辐射强迫(短波+长波)为0.2±0.2 W m−2,使沙尘在中国地表总体上产生升温效应。7个ACCMIP模式模拟的全球平均值为−0.5±0.4 W m−2,该负强迫略小于文献报道的范围−1.5~−0.53 W m−2(Liao et al., 2004; Yue et al., 2010a, 2010b)。
以上辐射强迫的计算结果基于GISS GCM II′模式,虽然和其他模拟结果相比处于合理范围内,但值得注意的是,沙尘的辐射强迫还受到多种因素的影响,包括云量、沙尘的垂直分布、粒子大小、SSA、复折射指数和AOD (Liao and Seinfeld, 1998)。
5 结论7个ACCMIP模式模拟的中国沙尘气溶胶的排放主要集中在西北塔克拉玛干和戈壁沙漠及其周边地区。中国沙尘年排放总量在67(GISS-TOMAS)~510(CAM5.1) Tg a−1范围内,平均值为215±163 Tg a−1。沙尘年平均地表浓度和柱浓度的最大值出现在塔克拉玛干和戈壁沙漠,随后从中国西北至东南逐渐降低。中国平均年均地表浓度在21(MIROC)~89(CAM5.1) µg m−3范围内,平均值为41±27 µg m−3。与2006~2007年CAWNET观测的地表沙尘浓度对比发现,大多数模式的结果低于观测值,低估了12.3%~78.6%,而CAM5.1模式高估了6.6%。中国平均年均柱浓度在6(GFDL)~15(CAM5.1) kg m−2范围内,平均值为9±4 kg m−2。值得注意的是,各模式模拟的中国柱浓度和排放之间大体呈线性关系,而地表浓度和排放之间并不完全呈线性关系,例如HadGEM2和MIROC模拟的中国年排放总量在7个模式中较大,但地表浓度却较小,说明垂直输送对这两个模式地表浓度的影响很大。
基于7个ACCMIP模式模拟的中国地区沙尘气溶胶浓度,本文统一使用GISS GCM II′大气环流模式的辐射传输方案计算中国沙尘气溶胶的直接辐射强迫。结果显示,7个模式模拟的中国年均沙尘AOD在0.05(GFDL)~0.18(CAM5.1)范围内,平均值为0.09±0.05。和MISR卫星观测的总气溶胶的AOD对比发现,大多数模式模拟的中国西北平均沙尘AOD低估了42%~57%,而CAM3.5和CAM5.1分别高估了28%和82%。中国沙尘气溶胶辐射强迫的空间分布和沙尘浓度的空间分布类似,并且在大多数中国地区沙尘浓度越高产生的辐射强迫越大。7个模式模拟的中国区域年均沙尘气溶胶大气顶短波辐射强迫的范围是−0.6(GFDL)~−2.5(CAM5.1) W m−2,平均值为−1.3±0.8 W m−2;大气顶长波辐射强迫的范围是0.3(GFDL)~1.3(HadGEM2) W m−2,平均值为0.7±0.4 W m−2;总的(短波+长波)大气顶辐射强迫的范围是−1.6(CAM5.1)~0.2(HadGEM2) W m−2,平均值为−0.5±0.7 W m−2。地表短波辐射强迫的范围是−3.1(CAM5.1)~−0.8(GFDL) W m−2,平均值为−1.5±1.0 W m−2;地表长波辐射强迫的范围是1.1(HadGEM2)~3.2(CAM5.1) W m−2,平均值为1.8±0.9 W m−2;总的(短波+长波)地表辐射强迫的范围是−0.1(HadGEM2)~0.4(GFDL) W m−2, 平均值为0.2±0.2 W m−2。值得注意的是,高层沙尘气溶胶浓度越大,产生的大气顶长波辐射强迫越大,地表长波辐射强迫和地表沙尘浓度基本呈线性关系。说明中国平均沙尘气溶胶长波辐射强迫对沙尘浓度的垂直分布较敏感。而短波辐射强迫对垂直分布较不敏感,受整层柱浓度控制。
| [] | Albani S, Mahowald N M, Perry A T, et al. 2014. Improved dust representation in the Community Atmosphere Model[J]. J.Adv.Model.Earth Syst., 6(3) : 541–570 DOI:10.1002/2013MS000279 |
| [] | Aoki T, Tanaka T Y, Uchiyama A, et al. 2005. Sensitivity experiments of direct radiative forcing caused by mineral dust simulated with a chemical transport model[J]. J.Meteor.Soc.Japan, 83A : 315–331 DOI:10.2151/JMSJ.83A.315 |
| [] | Bowman K W, Shindell D T, Worden H M, et al. 2013. Evaluation of ACCMIP outgoing longwave radiation from tropospheric ozone using TES satellite observations[J]. Atmos.Chem.Phys., 13(8) : 4057–4072 DOI:10.5194/ACP-13-4057-2013 |
| [] | Chang W Y, Liao H. 2009. Anthropogenic direct radiative forcing of tropospheric ozone and aerosols from 1850 to 2000 estimated with IPCC AR5 emissions inventories[J]. Atmos.Oceanic Sci.Lett., 2(4) : 201–207 DOI:10.1080/16742834.2009.11446804 |
| [] | Collins W J, Bellouin N, Doutriaux-Boucher M, et al. 2011. Development and evaluation of an earth-system model-HadGEM2[J]. Geosci.Model Dev., 4(4) : 1051–1075 DOI:10.5194/GMD-4-1051-2011 |
| [] | Donner L J, Wyman B L, Hemler R S, et al. 2011. The dynamical core, physical parameterizations, and basic simulation characteristics of the atmospheric component AM3 of the GFDL global coupled model CM3[J]. J.Climate, 24(13) : 3484–3519 DOI:10.1175/2011JCLI3955.1 |
| [] | Gong S L, Zhang X Y, Zhao T L, et al. 2003. Characterization of soil dust aerosol in China and its transport and distribution during 2001 ACE-Asia:2[J]. Model simulation and validation[J].J.Geophys.Res., 108(D9) : 4262 DOI:10.1029/2002JD002633 |
| [] | Hansen J, Russell G, Rind D, et al. 1983. Efficient three-dimensional global models for climate studies:Models I and Ⅱ[J]. Mon.Wea.Rev., 111(4) : 609–662 DOI:10.1175/1520-0493(1983)111<0609:ETDGMF>2.0.CO;2 |
| [] | Huang J P, Lin B, Minnis P, et al. 2006. Satellite-based assessment of possible dust aerosols semi-direct effect on cloud water path over East Asia[J]. Geophys.Res.Lett., 33(19) : L19802 DOI:10.1029/2006GL026561 |
| [] | Huang J, Fu Q, Su J, et al. 2009. Taklimakan dust aerosol radiative heating derived from CALIPSO observations using the Fu-Liou radiation model with CERES constraints[J]. Atmos.Chem.Phys., 9(12) : 4011–4021 DOI:10.5194/acp-9-4011-2009 |
| [] | IPCC.2007.The Physical Science Basis of Climate Change:Changes in Atmospheric Constituents and in Radiative Forcing[M].Piers F, Venkatachalam R, Paulo A, et al., Eds.Cambridge, UK and New York, USA:Cambridge University Press, 996pp. |
| [] | IPCC.2013.The Physical Science Basis of Climate Change:Clouds and Aerosols[M].Stocker T F, Qin D, Plattner G K, et al., Eds.Cambridge, UK and New York, USA:Cambridge University Press, 1535pp. |
| [] | Jacobson M Z. 2001. Global direct radiative forcing due to multicomponent anthropogenic and natural aerosols[J]. J.Geophys.Res., 106(D2) : 1551–1568 DOI:10.1029/2000JD900514 |
| [] | Koch D, Schmidt G A, Field C V. 2006. Sulfur, sea salt, and radionuclide aerosols in GISS ModelE[J]. J.Geophys.Res., 111(D6) : D06206 DOI:10.1029/2004JD005550 |
| [] | Lacis A A, Hansen J E. 1974. A parameterization for the absorption of solar radiation in the earth's atmosphere[J]. J.Atmos.Sci., 31(1) : 118–133 DOI:10.1175/1520-0469(1974)031<0118:APFTAO>2.0.CO;2 |
| [] | Lamarque J F, Kyle G P, Meinshausen M, et al. 2011. Global and regional evolution of short-lived radiatively-active gases and aerosols in the representative concentration pathways[J]. Climatic Change, 109(1-2) : 191–212 DOI:10.1007/SL0584-011-0155-0 |
| [] | Lamarque J F, Emmons L K, Hess P G, et al. 2012. CAM-chem:Description and evaluation of interactive atmospheric chemistry in the Community Earth System Model[J]. Geosci.Model Dev., 5(2) : 369–411 DOI:10.5194/GMD-5-369-2012 |
| [] | Lamarque J F, Dentener F, McConnell J, et al. 2013a. Multi-model mean nitrogen and sulfur deposition from the Atmospheric Chemistry and Climate Model Intercomparison Project (ACCMIP):Evaluation of historical and projected future changes[J]. Atmos.Chem.Phys., 13(16) : 7997–8018 DOI:10.5194/ACP-13-7997-2013 |
| [] | Lamarque J F, Shindell D T, Josse B, et al. 2013b. The Atmospheric Chemistry and Climate Model Intercomparison Project (ACCMIP):Overview and description of models, simulations and climate diagnostics[J]. Geosci.Model Dev., 6(1) : 179–206 DOI:10.5194/GMD-6-179-2013 |
| [] | Lee Y H, Chen K, Adams P J. 2009. Development of a global model of mineral dust aerosol microphysics[J]. Atmos.Chem.Phys., 9(7) : 2441–2458 DOI:10.5194/acp-9-2441-2009 |
| [] | Lee Y H, Adams P J. 2012. A fast and efficient version of the TwO-Moment Aerosol Sectional (TOMAS) global aerosol microphysics model[J]. Aerosol Sci.Technol., 46(6) : 678–689 DOI:10.1080/02786826.2011.643259 |
| [] | Lee Y H, Lamarque J F, Flanner M G, et al. 2013. Evaluation of preindustrial to present-day black carbon and its albedo forcing from Atmospheric Chemistry and Climate Model Intercomparison Project (ACCMIP)[J]. Atmos.Chem.Phys., 13(5) : 2607–2634 DOI:10.5194/ACP-13-2607-2013 |
| [] | Li F Y, Ginoux P, Ramaswamy V. 2008. Distribution, transport, and deposition of mineral dust in the Southern Ocean and Antarctica:Contribution of major sources[J]. J.Geophys.Res., 113(D10) : D10207 DOI:10.1029/2007JD009190 |
| [] | Liao H, Seinfeld J H. 1998. Radiative forcing by mineral dust aerosols:Sensitivity to key variables[J]. J.Geophys.Res., 103(D24) : 31637–31645 DOI:10.1029/1998JD200036 |
| [] | Liao H, Seinfeld J H, Adams P J, et al. 2004. Global radiative forcing of coupled tropospheric ozone and aerosols in a unified general circulation model[J]. J.Geophys.Res., 109(D16) : D16207 DOI:10.1029/2003JD004456 |
| [] | Liu X H, Easter R C, Ghan S J, et al. 2012. Toward a minimal representation of aerosols in climate models:Description and evaluation in the Community Atmosphere Model CAM5[J]. Geosci.Model Dev., 5(3) : 709–739 DOI:10.5194/GMD-5-709-2012 |
| [] | Mahowald N M, Muhs D R, Levis S, et al. 2006. Change in atmospheric mineral aerosols in response to climate:Last glacial period, preindustrial, modern, and doubled carbon dioxide climates[J]. J.Geophys.Res., 111(D10) : D10202 DOI:10.1029/2005JD006653 |
| [] | Mikami M, Shi G Y, Uno I, et al. 2006. Aeolian dust experiment on climate impact:An overview of Japan-China joint project ADEC[J]. Global Planet.Change, 52(1-4) : 142–172 DOI:10.1016/j.gloplacha.2006.03.001 |
| [] | Miller R L, Cakmur R V, Perlwitz J, et al. 2006. Mineral dust aerosols in the NASA Goddard Institute for Space Sciences ModelE atmospheric general circulation model[J]. J.Geophys.Res., 111(D6) : D06208 DOI:10.1029/2005JD005796 |
| [] | Myhre G, Stordal F. 2001. Global sensitivity experiments of the radiative forcing due to mineral aerosols[J]. J.Geophys.Res., 106(D16) : 18193–18204 DOI:10.1029/2000JD900536 |
| [] | Naik V, Voulgarakis A, Fiore A M, et al. 2013. Preindustrial to present-day changes in tropospheric hydroxyl radical and methane lifetime from the Atmospheric Chemistry and Climate Model Intercomparison Project (ACCMIP)[J]. Atmos.Chem.Phys., 13(10) : 5277–5298 DOI:10.5194/ACP-13-5277-2013 |
| [] | Reddy M S, Boucher O, Balkanski Y, et al. 2005. Aerosol optical depths and direct radiative perturbations by species and source type[J]. Geophys.Res.Lett., 32(12) : L12803 DOI:10.1029/2004GL021743 |
| [] | Shindell D T, Pechony O, Voulgarakis A, et al. 2013. Interactive ozone and methane chemistry in GISS-E2 historical and future climate simulations[J]. Atmos.Chem.Phys., 13(5) : 2653–2689 DOI:10.5194/ACP-13-2653-2013 |
| [] | Stevenson D S, Young P J, Naik V, et al. 2013. Tropospheric ozone changes, radiative forcing and attribution to emissions in the Atmospheric Chemistry and Climate Model Intercomparison Project (ACCMIP)[J]. Atmos.Chem.Phys., 13(6) : 3063–3085 DOI:10.5194/ACP-13-3063-2013 |
| [] | Sun H, Pan Z T, Liu X D. 2012. Numerical simulation of spatial-temporal distribution of dust aerosol and its direct radiative effects on East Asian climate[J]. J.Geophys.Res., 117(D13) : D13206 DOI:10.1029/2011JD017219 |
| [] | Takemura T, Okamoto H, Maruyama Y, et al. 2000. Global three-dimensional simulation of aerosol optical thickness distribution of various origins[J]. J.Geophys.Res., 105(D14) : 17853 DOI:10.1029/2000JD900265 |
| [] | Voulgarakis A, Naik V, Lamarque J F, et al. 2013. Analysis of present day and future OH and methane lifetime in the ACCMIP simulations[J]. Atmos.Chem.Phys., 13(5) : 2563–2587 DOI:10.5194/ACP-13-2563-2013 |
| [] | 王宏, 石广玉, AokiT, 等. 2004. 2001年春季东亚-北太平洋地区沙尘气溶胶的辐射强迫[J]. 科学通报, 49(20) : 2212–2219. Wang Hong, Shi Guangyu, Aoki T, et al. 2004. Radiative forcing due to dust aerosol over east Asia-North Pacific region during spring, 2001[J]. Chinese Sci.Bull.(in Chinese), 49(20) : 2212–2219 DOI:10.1007/BF03185790 |
| [] | Watanabe S, Hajima T, Sudo K, et al. 2011. MIROC-ESM 2010:Model description and basic results of CMIP5-20c3m experiments[J]. Geosci.Model Dev., 4(4) : 845–872 DOI:10.5194/GMD-4-845-2011 |
| [] | Woodward S.2011.Mineral dust in HadGEM2[R].Hadley Centre Technical Note.87. |
| [] | 吴涧, 符淙斌, 蒋维楣, 等. 2005. 东亚地区矿物尘气溶胶直接辐射强迫的初步模拟研究[J]. 地球物理学报, 48(6) : 1250–1260. Wu Jian, Fu Congbin, Jiang Weimei, et al. 2005. A preliminary simulation study of direct radiative forcing of mineral dust aerosol over the East Asia region[J]. Chinese J.Geophys.(in Chinese), 48(6) : 1250–1260 DOI:10.3321/j.issn:0001-5733.2005.06.005 |
| [] | Young P J, Archibald A T, Bowman K W, et al. 2013. Pre-industrial to end 21st century projections of tropospheric ozone from the Atmospheric Chemistry and Climate Model Intercomparison Project (ACCMIP)[J]. Atmos.Chem.Phys., 13(4) : 2063–2090 DOI:10.5194/ACP-13-2063-2013 |
| [] | Yue X, Wang H J, Liao H, et al. 2010a. Direct climatic effect of dust aerosol in the NCAR Community Atmosphere Model Version 3(CAM3)[J]. Adv.Atmos.Sci., 27(2) : 230–242 DOI:10.1007/S00376-009-8170-Z |
| [] | Yue X, Wang H J, Liao H, et al. 2010b. Simulation of dust aerosol radiative feedback using the GMOD:2[J]. Dust-climate interactions[J].J.Geophys.Res., 115(D4) : D04201 DOI:10.1029/2009JD012063 |
| [] | Zender C S, Bian H S, Newman D. 2003. Mineral dust entrainment and deposition (DEAD) model:Description and 1990s dust climatology[J]. J.Geophys.Res., 108(D14) : 4416 DOI:10.1029/2002JD002775 |
| [] | Zhang X Y, Wang Y Q, Niu T, et al. 2012. Atmospheric aerosol compositions in China:Spatial/temporal variability, chemical signature, regional haze distribution and comparisons with global aerosols[J]. Atmos.Chem.Phys., 12(2) : 779–799 DOI:10.5194/ACP-12-779-2012 |