2 南京信息工程大学大气科学学院, 南京 210044
2 College of Atmospheric Sciences, Nanjing University of Information Science & Technology, Nanjing 210044
热带环流系统影响着全球天气与气候,作为其重要的组成部分,赤道纬向—垂直环流的活动和变化与热带、中纬度地区乃至全球大气环流的变化都有密切关系。
对于赤道上空纬向—垂直环流的研究,过去大多数工作着眼于太平洋上的Walker环流。Walker环流延伸横跨整个热带太平洋,由底层从东向西吹的信风、西太平洋附近的上升气流、高层与信风反向的西风和东太平洋的下沉气流构成(Gill,1982)。Bjerknes认为这种环流结构与南方涛动有很大关系。当南方涛动处于暖海温(El Niño)时,Walker环流减弱,其上升支较常年偏东,La Niña期间则相反(Bayr et al.,2014)。在年代际尺度上,迄今已有很多研究指出Walker环流的强度在过去60年间有所减弱(Tanaka et al.,2004;Vecchi et al.,2006;Zhang and Song,2006;Nicholls,2008;Collins et al.,2010;Vecchi and Wittenberg,2010;Power and Kociuba,2011)。部分学者用环流上升支的能量和质量守恒原理来解释这种减弱,即由于温室效应的加剧,海表面温度进一步上升,伴随降水量和水汽通量增长率的差异,大气对流循环减弱,最终影响到低层风场以纬向风为主的Walker环流(Tanaka et al.,2004;Trenberth et al.,2005;Held and Soden,2006;Vecchi and Soden,2007);也有学者持不同观点,认为Walker环流的减弱并非由于大范围海温升高引起的大气环流变化,而是由于海温纬向梯度的减弱(Tokinaga et al.,2012a)或El Niño频率的升高(Nicholls,2008)。近年来,有研究通过对近期高质量观测资料的分析发现,Walker环流在过去20到30年间有增强的趋势(Meng et al.,2011;Luo et al.,2012;Sohn et al.,2013;L'Heureux et al.,2013;Mcgregor et al.,2014;Bayr et al.,2014),增强的原因可能与大西洋增暖带来的东太平洋变冷(Mcgregor et al.,2014)、印度洋增暖快于太平洋(Luo et al.,2012)或者中部型El Niño出现增多(Bayr et al.,2014;Sohn et al.,2013)有关。
很多研究认为Walker环流只是赤道带纬向环流圈中的一部分,在赤道印度洋、大西洋等地区上空同样存在纬向—垂直环流圈(Flohn and Fleer,1975;Newell,1979;Holton,2004)。赤道印度洋上空的纬向—垂直环流方向与Walker环流相反,暖空气在印尼群岛及东印度洋一带上升,西移至西印度洋附近下沉,再在低层向东流。商树荣和蒋尚成(2002)通过分析卫星资料反演的纬向—垂直环流后发现,赤道印度洋纬向—垂直环流的强度、位置和范围在一年之中存在较大变化,秋季垂直环流的强度最强、位置最东;冬季环流的范围最大。而在年代际尺度上,Yu and Zwiers(2010)发现年平均的赤道印度洋纬向—垂直环流在1957~2002年间有不显著的增强趋势。热带印度洋是热带海洋的一个重要组成部分,由于印度洋特殊的地理位置,与亚澳季风系统、ENSO系统和非洲季风系统都存在一定联系,其海—气相互作用对局地和全球气候变化有着重要影响。Nicholson(2014)指出赤道印度洋纬向—垂直环流对东非的降水预报有很重要的作用。Hastenrath et al.(2011)发现赤道印度洋表层西风的强度与赤道东非降水在秋季存在显著负相关。Pohl and Camberlin(2006)则发现其使用高低层风切变定义的赤道印度洋纬向环流指数与东北非洲降水在春季和秋季均存在显著的相关。相对于Walker环流的大量研究工作,对赤道印度洋纬向—垂直环流的了解还较为有限,由于热带印度洋是世界上最明显的季风区之一,其上空的垂直环流与季风的变化密切相关,本文将对赤道印度洋纬向—垂直环流的季节性差异及其在春季的变化特征展开讨论。
此外,自具有全球尺度的ENSO影响信号提出后,人们逐渐把全球的海洋联系起来。有学者根据观测资料分析提出了“热带大气桥”的思想(Klein et al.,1999),指出热带太平洋和热带印度洋可以通过二者上空的大气相联系并产生相互作用。吴国雄和孟文(1998)认为赤道印度洋上空的季风纬向环流和太平洋上空的Walker环流类似于一对齿轮耦合在一起,其啮合点位于印尼群岛附近,齿轮式耦合的年际异常与ENSO事件存在很好的对应关系。作为印度洋和太平洋上空的纬向—垂直环流,赤道印度洋纬向—垂直环流与Walker环流之间的关系究竟如何、其关系是否随着时间改变,也是值得研究的问题。
2 资料和方法 2.1 资料本文所使用的资料包括:(1)美国国家大气海洋局(National Oceanic and Atmospheric Administration,简称NOAA)提供的20世纪再分析资料(20th Century Reanalysis Version 2,简称20CR)中的月平均风场资料(Compo et al.,2011),该资料的水平分辨率为2°×2°,本文选取时段为1951年1月至2010年12月;(2)NOAA提供的月平均海表温度资料ERSST V3b(ExtendedReconstructedSea SurfaceTemperature V3b;Smith et al.,2008),该资料的水平分辨率为2°×2°,本文选取时段为1951年1月至2010年12月;(3)欧洲中期天气预报中心(European Centre for Medium-Range Weather Forecasts,简称ECMWF)提供的ERA-40(Uppala et al.,2005)和ERA-interim(Simmons et al.,2007)再分析资料中的逐月纬向风场资料,资料的水平分辨率为2°×2°,选取时间段分别为1958~1978年和1979~2010年,两者相接成为时间范围1958~2010年的数据,以下称ERA40in。
2.2 方法选取赤道印度洋上空(4°S~4°N,60°~90°E)区域平均的表层纬向风、经向风作为表层纬向风强度指数(UEQ)、表层经向风强度指数(VEQ)。通过分析多年平均(1951年至2010年60年平均,下 文除特别指出外均相同)的UEQ和VEQ的季节变化,以及不同季节热带印度洋上空高低层辐散风场的情况,讨论赤道印度洋纬向—垂直环流的季节性差异。
为探究赤道印度洋纬向—垂直环流的强度变化,采用(4°S~4°N,60°~90°E)区域平均的 850 hPa和200 hPa纬向风切变(低层减高层,指数大表示环流强)的标准化时间序列作为赤道印度洋纬向—垂直环流强度指数(UShear),其趋势由最小二乘线性回归分析求得。类似的,采用赤道太平洋上空(4°S~4°N,160°E~100°W)区域平均的850 hPa和200 hPa纬向风切变(高层减低层,指数大表示环流强)的标准化时间序列作为Walker环流强度指数(UShearPC;何敏,1999)。
除了风切变指数外,纬向质量通量流函数(ψ)可以较为直观地体现纬向—垂直环流的强度和位置情况。ψ定义为
| $\psi (p)=2\text{ }\!\!\pi\!\!\text{ }a/g\int\limits_{p'}^{p}{{{u}_{D}}dp},$ | (1) |
其中,地球半径a、气压p、重力常数g、纬向辐散风uD(Yu and Boer,2002)。计算时将4°S和4°N之间纬向辐散风进行平均,并由10 hPa积分到1000 hPa,乘以常数得到赤道地区的纬向质量通量流函数。对赤道印度洋上空的纬向质量通量流函数进行EOF(Empirical Orthogonal Function)分析可探究赤道上空纬向—垂直环流的强度和位置变化情况。
3 赤道印度洋上空纬向—垂直环流的季节性差异图 1a、b分别给出了多年平均的UEQ和VEQ随季节的演变(基于20CR月平均风场资料计算得到,下文除特别指出外均使用该风场资料)。从图 1a可以看出,赤道印度洋上空表层风场的纬向风分量除在1月、2月为负值(东风)外,其余月份均为正值(西风),UEQ的较大值出现在4~5月和10~11月。另外,由图 1还可以看到,VEQ在4月和11月最接近0值(图 1b),表明在这两个月赤道印度洋上空表层风场的经向风分量最小,而在其他月份经向风分量较大。Hastenrath(2007)认为,由于南印度洋东南信风与赤道印度洋上空的东西纬向气压差均在夏季达到最大,冬季则最小,而在春季和秋季两个过渡季节,科氏力与气压梯度力的共同作用使得南印度洋的东南信风在南半球的较高纬度转向,有利于赤道印度洋上空西风带的发展。综上可以看出,在冬季风和夏季风的转换季节,即春季和秋季,赤道印度洋上空存在较强的西风气流。

|
图 1 多年平均的(a)纬向风UEQ 指数和(b)经向风VEQ 指数的季节变化(单位:m s−1) Figure 1 Seasonal variations of long-term mean indexes of (a) zonal wind (UEQ) and (b) radial wind (VEQ). Units: m s−1 |
热带印度洋是世界上季风现象最显著的地区之一,伴随着季风的爆发和撤退,大范围风场存在明显的季节转换。6~9月(JJAS)印度夏季风盛行,赤道辐合带(ITCZ)的位置达到最北;1~2月(JF)ITCZ的位置达到最南;3~5月(MAM)和10~12月(OND)为过渡时段,这两个时段也分别对应着东非的两个雨季。Pohl and Camberlin(2011)根据ITCZ的这种季节性迁徙,将3~5月、6~9月、10~12月和1~2月划分为春季、夏季、秋季和冬季四个季节,本文也采用上述热带印度洋的季节定义。
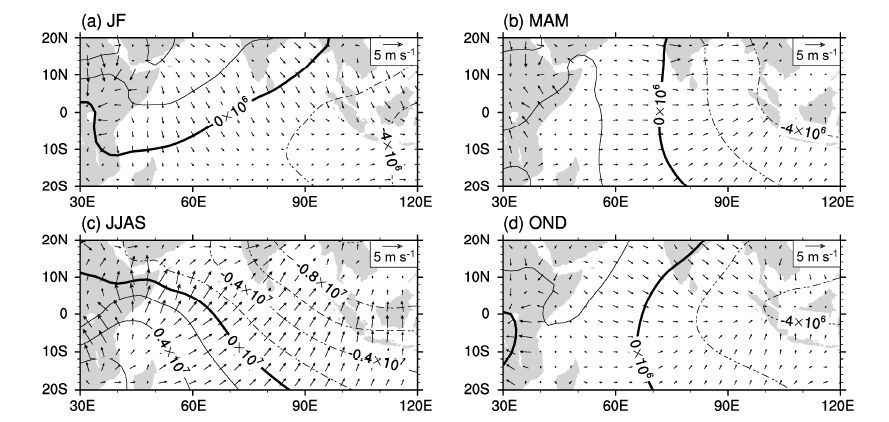
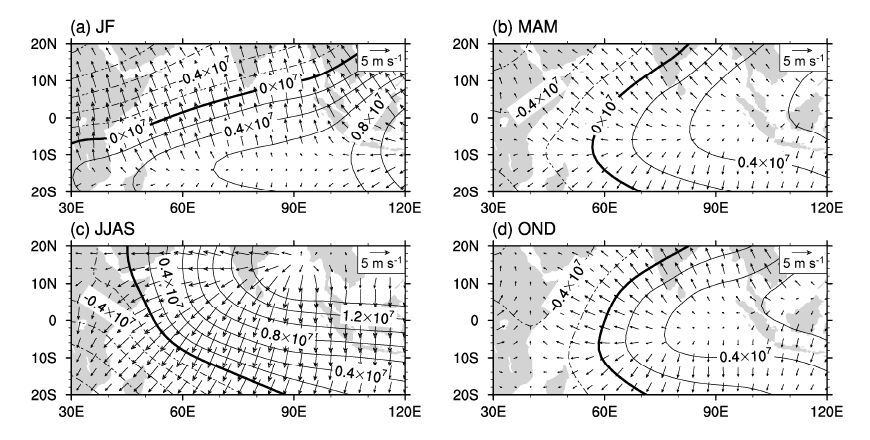
图 2a、c分别给出了冬季和夏季热带印度洋上空200 hPa的辐散风场,可以看到赤道上空的辐散风除了有由东向西的纬向分量,还有很大的经向分量;850 hPa的辐散风场也有类似的特征(图 3a、c)。故在冬(夏)季,高、低层的东南(东北)和西北(西南)辐散风,结合东部和西部的上升和下沉运动形成垂直环流圈,该垂直环流在具有纬向—垂直环流分量的同时也具有较大的经向分量。春季(图 2b和图 3b)和秋季(图 2d和图 3d)的情况则明显不同,由于赤道印度洋上空辐散风的经向分量很小,赤道印度洋东部上升中心和西部下沉中心之间有较为连续的纬向辐散风,850 hPa上存在由赤道西印度洋向赤道东印度洋的西风,而在200 hPa上则吹东风气流。高、低层的东风和西风气流,再结合东部和西部的上升和下沉运动,在春、秋季节 赤道印度洋上空形成严格东西方向的纬向—垂直环流。
|
图 2 多年平均的(a)冬季(JF)、(b)春季(MAM)、(c)夏季(JJAS)和(d)秋季(OND)热带印度洋上空200 hPa 辐散风场(箭头,单位:m s−1)和速度势(等值线,单位:m2 s−1) Figure 2 Long-term mean 200‐hPa divergent wind field (vectors, units: m s−1) and velocity potential field (contours, units: m2 s−1) in the (a) winter (January–February, JF), (b) spring (March–April–May, MAM), (c) summer (June–July–August–September, JJAS), and (d) autumn (October–November–December, OND) |
综合以上结果表明,赤道印度洋上空的纬向—垂直环流存在明显的季节性差异,春季和秋季赤道印度洋上空存在东西方向的纬向—垂直环流,而在冬季和夏季,赤道印度洋纬向—垂直环流为热带印度洋上空垂直环流在东西方向的分量。接下来,本文将就春季赤道印度洋纬向—垂直环流的变化作进一步的研究。
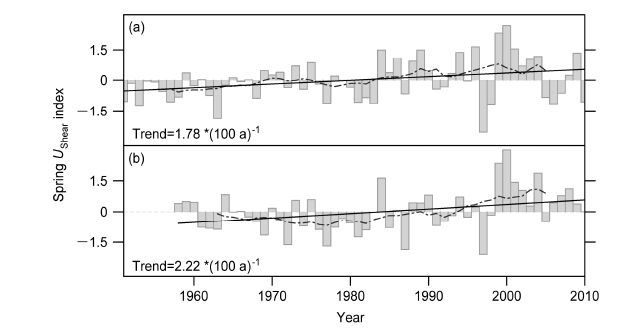
4 春季赤道印度洋纬向—垂直环流的变化特征 4.1 环流强度图 4a为基于20CR的风场资料计算得到的1951~2010年春季赤道印度洋纬向—垂直环流强度指数(UShear)随时间的演变。通过对其进行11年滑动平均和线性趋势分析后发现,除了明显的年际变化之外,春季赤道印度洋纬向—垂直环流还呈现明显的长期增强趋势。为了进一步验证该结果的可信性,采用ERA40in的风场资料同样计算了UShear指数(图 4b)。两种资料计算得到的UShear指数在两者的共同时段内(1958~2010年)存在很好的正相关(相关系数通过99%的信度检验)。
|
图 4 (a)20CR 和(b)ERA40in 资料计算的1951~2010 年春季UShear 指数(柱状图)及其11 年滑动平均(虚线)。倾斜直线为线性回归,指数的线性趋势标注在图左下方,星号表示趋势通过95%的信度检验 [根据Wilks(2011)提出的考虑有效自由度的t 检验] Figure 4 Temporal variation of the springtime UShear index (bars) during 1951–2010 based on the (a) 20CR and (b) ERA40 datasets, and its 11-year moving average (dashed lines). Inclined straight lines show the linear trends fit to the UShear, trend coefficients are labeled on the bottom left corners of the corresponding panels, asterisks indicate the trends are statistically significant at the 95% confidence level according to a t test proposed by Wilks(2011) that considers the effective degrees of freedom |
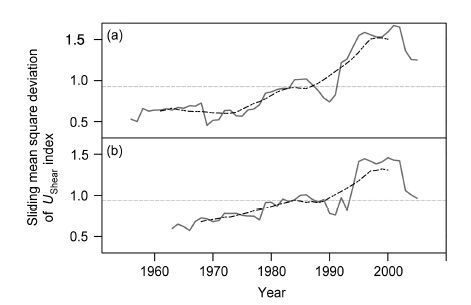
仔细分析图 4还可以发现,图中UShear的变化幅度在后期明显大于前期。施能等(2001)指出,气候变化也体现在要素的气候变率上,气象要素变率的改变与异常天气的频率及强度紧密联系,对于气象要素变率的变化可以简单地采用滑动均方差来表征。图 5给出了20CR资料计算的春季UShear指数的11年滑动均方差(图 5a),同时也给出了ERA40in资料计算的结果(图 5b)。从图中可以看到,无论采用20CR资料还是ERA40in资料计算的UShear指数的滑动均方差都表现出明显的上升趋势,说明赤道印度洋纬向—垂直环流强度的变化幅度在持续增大,后期的波动明显大于前期。以20CR资料计算的结果为例,1981~2010年UShear序列的均方差为1.2,而1951~1980年为0.6,后30年达到前30年的2倍。
|
图 5 (a)20CR 和(b)ERA40in 资料计算的UShear 指数的滑动均方差随时间的演变(实线)及其11 年滑动平均(虚曲线)。图中水平虚线是滑动均方差的平均值 Figure 5 Time series of sliding mean square deviation of the UShear index(solid line) and its 11-year moving average (dashed curve) based on the (a)20CR and (b) ERA40in dataset. Horizontal dashed lines indicate the averages of sliding mean square deviation |
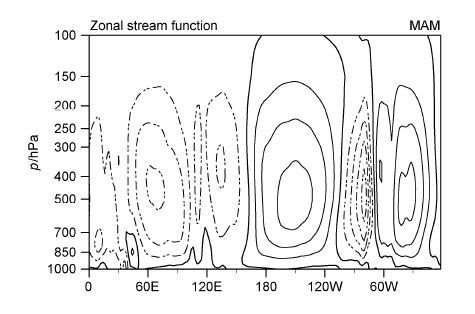
4.1节的分析清楚表明,春季赤道印度洋纬向—垂直环流的强度在增强、变化幅度也在增大,那么,该纬向—垂直环流的位置是否也发生了相应的改变呢?为此,这一小节中我们将通过分析印度洋赤道垂直平面上的纬向质量通量流函数(ψ)来探讨这个问题。图 6给出了多年平均赤道上空ψ垂直剖面分布图,其正值代表顺时针环流,负值代表逆时针环流。由图 6可见,赤道上空存在三个主要的上升运动区,分别位于赤道非洲、印度尼西亚和南美上空,而三个下沉运动区则分别位于西印度洋、太平洋冷舌区和大西洋上空。三个上升运动区和三个下沉运动区之间构成了三个主要纬向—垂直环流,分别位于印度洋、太平洋和大西洋上空。
|
图 6 多年平均的春季纬向质量通量流函数(ψ;4°S~4°N 平均)的垂直剖面分布。等值线间距:5×10¹⁰ kg s−1;实(虚)线为正(负),代表顺(逆)时针方向环流 Figure 6 Vertical cross section of the long-term mean zonal mass flux stream function (ψ, averaged over 4°S~4°N) in the spring. The contour interval is 5× 10¹⁰ kg s−1. Solid (dashed) lines indicate the positive (negative) ψ, which represent clockwise (anticlockwise) circulations |
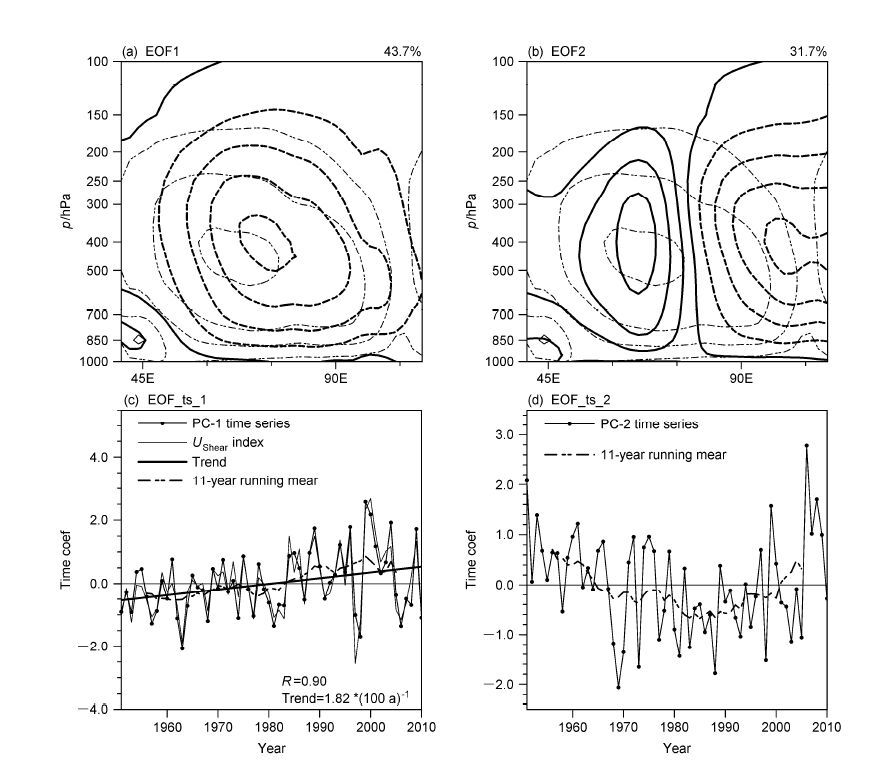
对1951~2010年春季赤道印度洋上空的ψ距平场进行EOF展开后发现,其第一特征向量的空间分布与多年平均的ψ分布类似(图 7a),其对应的标准化时间系数则表现为长期的显著增大趋势(图 7c),表明垂直环流的强度在增强(注意ψ的负值代表逆时针环流,故ψ的减小对应逆时针环流增强)。第一特征向量对应的时间系数与之前利用风切变定义的强度指数UShear间也存在显著的正相关,相关系数达0.90,远远超过了99%的信度检验。这表明两种不同方法定义的赤道印度洋纬向—垂直环流强度指数所揭示的春季垂直环流强度长期变化特征相一致,也进一步验证了上述结论的可靠性。另外,由图还可以清楚看到,第二特征向量的空间分布(图 7b)表现为西部减弱、东部增强的反相变化分布,体现了纬向—垂直环流中心位置的变化。由于其对应的时间系数(图 7d)表现为先减弱、后增强的变化趋势,表明纬向—垂直环流在1981年之前中心位置逐渐西移,而在1981年之后,纬向—垂直环流的中心位置则转为向东移动,明显表现出一种年代际的转折。
|
图 7 春季赤道印度洋上空纬向质量通量流函数(ψ)距平场的EOF(a)第一、(b)第二特征向量的空间分布(粗等值线)和对应的(c、d)标准化时间系数(点实线)。(a)、(b)中细等值线为多年平均的ψ,等值线间距为5×10¹⁰ kg s−1;(c)中倾斜直线为时间系数的线性回归,趋势标注在图右下角,星号表示通过95%的信度检验;细实线为同时期的UShear 指数,其与时间系数的相关系数(R)标注在图右下角,星号表示通过99%的信度检验;(c)、(d)中的虚线分别为时间系数的11 年滑动平均 Figure 7 The (a) first and (b) second EOF modes of the spring zonal mass flux stream function (ψ) anomalies over the equatorial Indian Ocean (thick contours) and (c, d) their corresponding standardized time coefficients (thick solid lines with dots). Thin contours in (a) and (b) indicate the long-term mean ψ with the contour interval of 5×10¹⁰ kg s−1. The inclined straight line in (c) shows the linear trend fit to the time coefficient; the trend coefficient is labeled on the bottom right corner of the figure; the asterisk indicates a statistically significant trend at the 95% confidence level. The thin solid line in (c) indicates the simultaneous UShear index; the correlation coefficient (R) between the UShear and time coefficient is labeled on the bottom right corner of the figure; the asterisk indicates a statistically significant correlation at the 95% confidence level. Dashed lines in (c) and (d) indicate the 11-year moving averages of time coefficients |
许多研究认为热带太平洋与印度洋的相互作用主要通过二者上空的大气相联系。吴国雄和孟文(1998)指出Walker环流与热带印度洋上空纬向季风环流之间存在显著耦合,纬向季风环流的异常可以通过印度洋和太平洋上空大气系统的齿轮式耦合来影响赤道中东太平洋的海气相互作用并触发ENSO事件发生(孟文和吴国雄,2000)。也有研究认为ENSO事件是印度洋偶极子的触发机制之一,指出El Niño的建立将导致赤道东印度洋的表面风场异常,继而作用于赤道东印度洋的海温并导致IOD(Indian Ocean Dipole)形成(Fischer et al.,2005;Nagura and Konda,2007)。Yu and Zwiers(2010)发现年平均的赤道印度洋纬向—垂直环流与Walker环流的强度都与ENSO的变化相关。
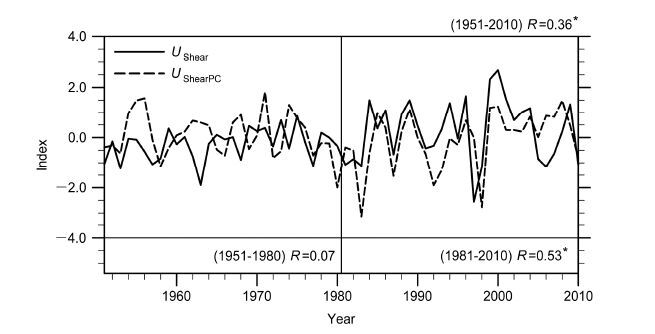
为了揭示赤道印度洋纬向—垂直环流与Walker环流两者之间的相关关系,对春季Walker环流强度指数(UShearPC)与赤道印度洋纬向—垂直环流强度指数(UShear)的相关性进行分析。由于我们关注的是年际变化尺度上的相关性,因此计算两者的相关系数之前均去除了两个强度指数的长期线性趋势。相关分析表明,在1951~2010年之间,UShearPC与UShear间存在显著正相关,相关系数为0.36,通过99%的信度检验。
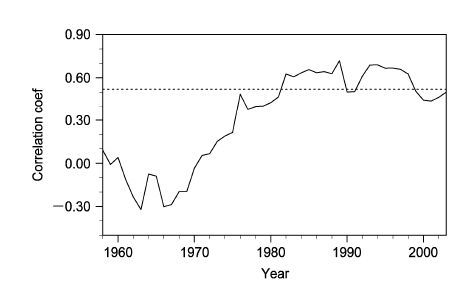
图 8给出了UShear和UShearPC的15年滑动相关系数。由图可见,两者的滑动相关系数从20世纪60年代中后期起逐步增大,并在1981年通过了95%的信度检验,说明两者的关系经历了由相关性较弱到显著正相关的转变。分时段进行考虑后,如图 9所示,1981~2010年赤道印度洋纬向—垂直环流强度与Walker环流间存在显著正相关,相关系数为0.53,通过99%的信度检验;而1981年之前赤道印度洋纬向—垂直环流强度与Walker环流间不存在显著相关。
|
图 8 春季赤道印度洋纬向—垂直环流强度指数与Walker 环流强度指数之间的15 年滑动相关系数。虚线:相关系数通过95%的信度检验 Figure 8 15-year sliding correlation coefficients between intensity index of the spring equatorial Indian Ocean zonal–vertical circulation and the Walker circulation. Dashed line shows the value at/above the 95% confidence level |
|
图 9 1951~2010 年春季赤道印度洋纬向—垂直环流强度指数(实线)与Walker 环流强度指数(虚线)。两者在1951~2010 年之间的相关系数标注在图右上角,分时段的相关系数标注在图底部,星号表示通过99%的信度检验 Figure 9 Intensity indexes of the spring equatorial Indian Ocean zonal–vertical circulation and Walker circulation during 1951–2010. The correlation coefficient for the period of 1951–2010 is labeled on the top right corner of the figure, while the correlation coefficients for the two separate periods (1951–1980 and 1981–2010) are labeled on the bottom of the figure, respectively; asterisks indicate statistically significant correlations at the 99% confidence level |
综上可见,赤道印度洋纬向—垂直环流与Walker环流在近30年间耦合较好,而在之前的30年则不存在显著的相关关系。
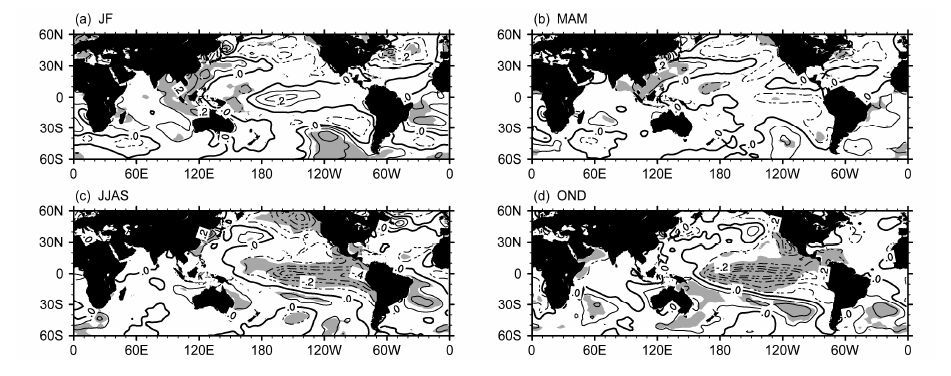
6 春季赤道印度洋纬向—垂直环流强度与海温的关系很多学者从不同角度出发,发现海温在赤道上空纬向—垂直环流的变化中起着重要的作用。例如,Tokinaga et al.(2012a)指出,海温纬向梯度的减弱是过去60年间Walker环流强度减弱的原因,由于赤道西太平洋和赤道东印度洋的增暖速度慢于赤道东太平洋和赤道西印度洋,致使赤道东西太平洋间的海温梯度减小,Walker环流减弱(Tokinaga et al.,2012b)。Luo et al.(2012)则认为近几十年加剧的印度洋增暖使得赤道西太平洋信风增强,从而加强了Walker环流。如前文所述,1981年后春季赤道印度洋纬向—垂直环流与Walker环流的强度之间存在较好的正相关,且1981~2010年春季赤道印度洋纬向—垂直环流强度的变化率明显高于之前30年。为了解海温在其中起了什么样的作用,分别用前后30年的春季UShear指数与距平海温做回归。
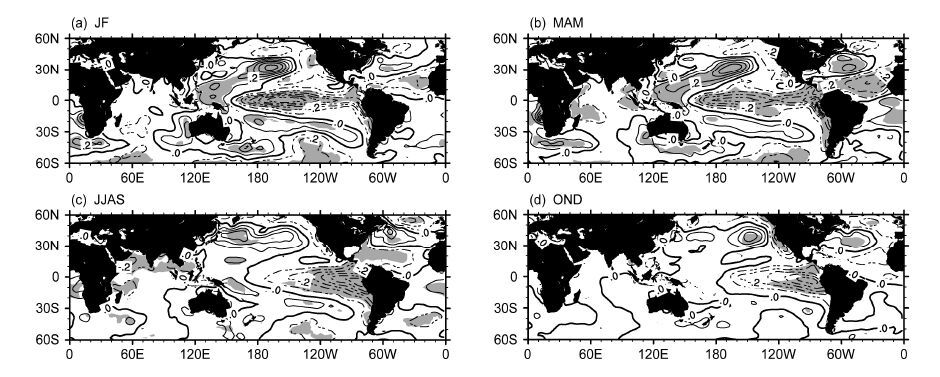
图 10给出了1951~1980年前期冬季、同期春季和后期夏季、秋季的海温距平对春季UShear指数的回归场。可以清楚看到,赤道印度洋纬向—垂直环流强度变化与前期冬季和同期春季的赤道东印度洋海温异常显著相关,而后期夏季和秋季则与赤道中东太平洋的海温异常有关,表明前期冬季和同期春季赤道东印度洋海温的升高(降低)使得春季赤道印度洋纬向—垂直环流强度偏强(弱),并通过纬向—垂直环流进而影响到后期夏季和秋季赤道中东太平洋的海温异常偏低(高)。由此可见,1951~1980年间,春季赤道印度洋纬向—垂直环流的强度主要受到前期和同期赤道东印度洋海温的影响,纬向—垂直环流的变化继而影响到后期太平洋海温。
|
图 10 1951~1980 年(a)前期冬季、(b)同期春季、(c)后期夏季和(d)后期秋季的海温距平场(单位:℃)与春季UShear 指数的回归分析。阴影区表示通过95%的信度检验的区域 Figure 10 SST anomalies (units: ℃) in (a) the previous winter, (b) the simultaneous spring, and the subsequent (c) summer and (d) autumn regressed on the spring UShear index for the period of 1951 to 1980. Shaded areas are for values at/above the 95% confidence level |
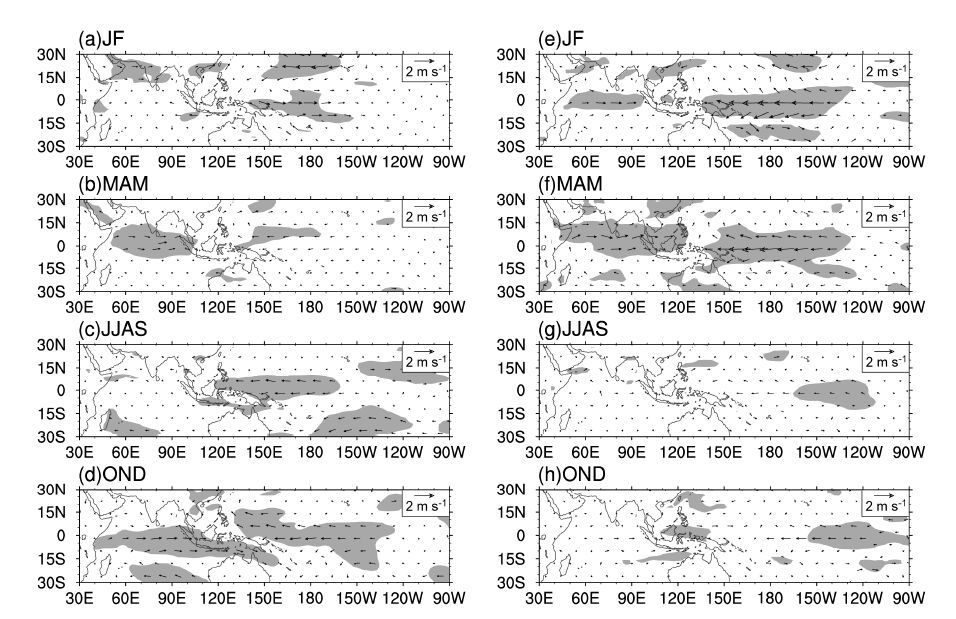
1981~2010年海温距平对春季赤道印度洋纬向—垂直环流强度指数的回归结果显示(图 11),在前期冬季和同期春季,热带太平洋海温距平与UShear指数间存在大范围的显著相关区,其相关分布与El Niño/La Niña海温异常的分布型相一致。 表明,前期冬季和同期春季太平洋上La Niña(El Niño)型的海温分布使得春季赤道印度洋纬向—垂直环流强度偏强(弱),继而通过纬向—垂直环流使得后期热带印度洋海温偏冷(暖)。说明前期和同期太平洋上的ENSO型海温异常信号影响到赤道印度洋纬向—垂直环流的变化,垂直环流的变化继而影响后期热带印度洋的海温。Xie et al.(2010)指出,热带印度洋对ENSO的响应存在年代际变化,19世纪70年代中期之后ENSO对热带印度洋的影响明显增强,El Niño的影响可以持续到其本身已经消亡的夏季,造成热带印度洋海温异常增暖,与本文所得结论相一致。从垂直环流强度指数与850 hPa风场的回归图(图 12)中也可以看出,1981~2010年春季太平洋上的纬向风对赤道印度洋纬向—垂直环流存在显著影响(图 12f),而这种关系在1951~1980年则并不显著(图 12b)。
|
图 12 1951~1980(左列)和1981~2010(右列)年(a、e)前期冬季、(b、f)同期夏季、(c、g)后期夏季和(d、h)后期秋季的850 hPa 风场与春季UShear 指数的回归分析。阴影区表示纬向风场的回归通过95%的信度检验的区域 Figure 12 850-hPa wind fields in (a, e) the previous winter, (b, f) the simultaneous spring and the subsequent (c, g) summer and (d, h) autumn regressed on the spring UShear index for the periods of 1951 to 1980 (left column) and 1981 to 2010 (right column). Shaded areas are for values at the 95% confidence level |
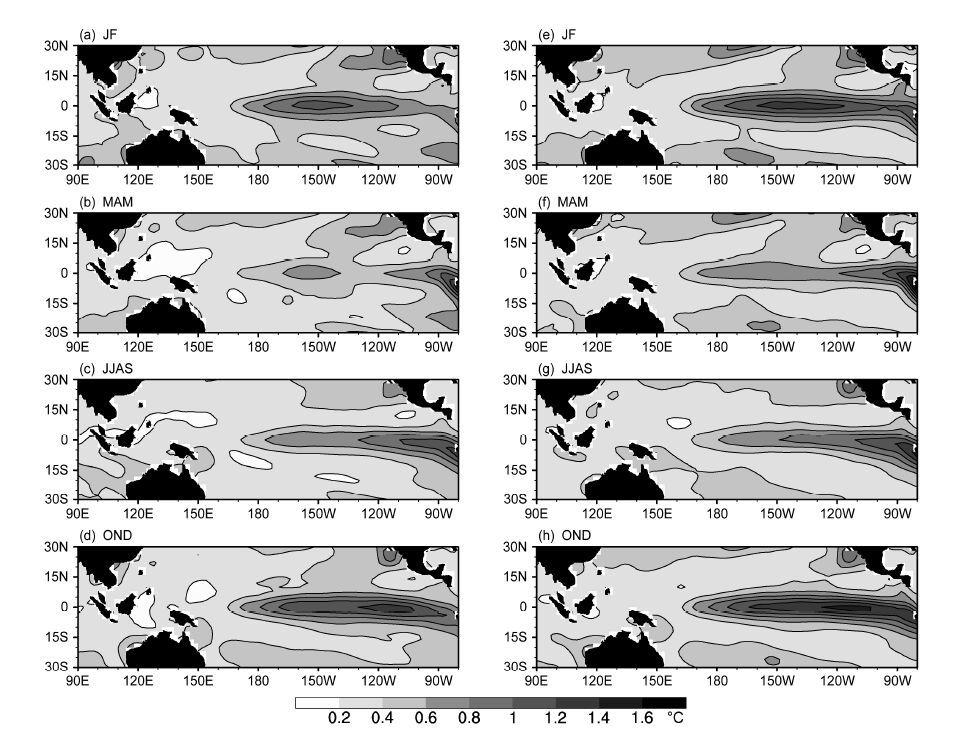
图 13给出了前后两个时段四季热带太平洋海温的标准差。可以看出,赤道中东太平洋是海温年际变化较为明显的区域。对比两图可发现,1981~2010年间赤道中东太平洋海温的标准差明显较1951~1980年间增大,海温年际变化较大的区域类似于 ENSO 事件时海温的分布,说明后一阶段ENSO的年际变化明显增强,这可能是造成后一阶段UShear指数与前期冬季和同期春季的热带太平洋海温异常出现大范围显著相关区的主要原因。
|
图 13 1951~1980(左列)和1981~2010(右列)年(a、e)前期冬季、(b、f)同期夏季、(c、g)后期夏季和(d、h)后期秋季的海温的标准差。 等值线间距为0.2℃ Figure 13 Standard deviations of tropical Pacific SST in (a, e) the previous winter, (b, f) the simultaneous spring, and the subsequent (c, g) summer and (d, h)autumn for the periods of 1951 to 1980 (left column) and 1981 to 2010 (right column). The contour interval is 0.2℃ |
以往关于赤道上空纬向—垂直环流的研究大多着眼于太平洋上Walker环流,而针对赤道印度洋纬向—垂直环流的研究相对较少。本文从赤道印度洋纬向—垂直环流的角度出发,探讨了其季节性差异、变化特征及其与Walker环流的关系,得到以下主要结果:
(1) 赤道印度洋上空的纬向—垂直环流存在明显的季节性差异,春季和秋季赤道印度洋上空存在东西方向的纬向—垂直环流,而冬季和夏季的赤道印度洋纬向—垂直环流为热带印度洋上空垂直环流在东西方向的分量。
(2) 春季赤道印度洋纬向—垂直环流的强度及其变率在1951~2010年持续增强,而其中心位置的变化则经历了一次年代际的转折,1981年之前明显表现为向西移动,而在1981年之后则转为向东移动。
(3) 春季赤道印度洋纬向—垂直环流与Walker环流的相关性也存在明显的年代际变化,1981年之前两者之间并不存在显著的相关,而在1981年之后,两者之间的关系显著增强。
(4) 不同年代际时段内春季赤道印度洋纬向—垂直环流与海温的关系存在明显差异:1951~1980年,垂直环流强度的年际变化主要受到前期和同期赤道东印度洋海温的影响,垂直环流的变化继而对后期夏、秋季的赤道中东太平洋海温异常产生影响;而在1981~2010年,垂直环流强度的年际变化主要受到前期和同期赤道太平洋上El Niño/La Niña型海温异常的影响,海温异常进而通过该垂直环流对后期夏季的印度洋海温异常产生影响。
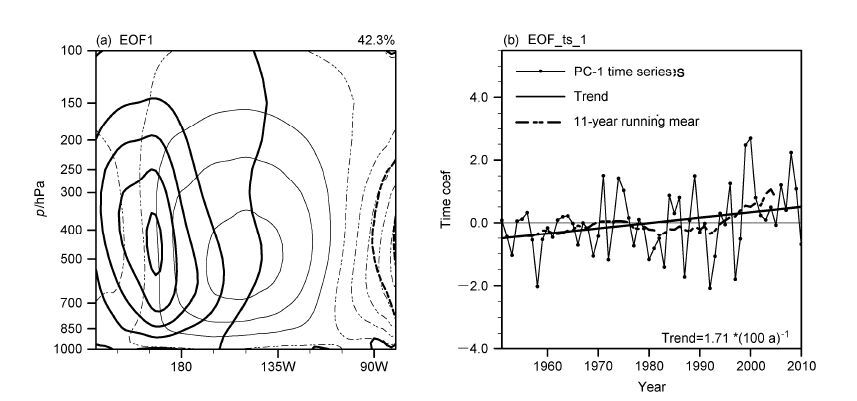
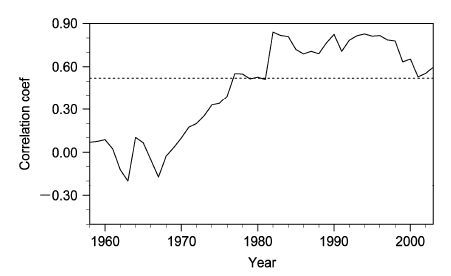
值得指出的是,春季赤道太平洋上空ψ距平场的EOF第一特征向量的空间分布表现为西部增强、东部减弱的反相变化形态(图 14a),其对应的时间系数呈现出长期的显著增大趋势,对应Walker环流中心位置的向西移动(图 14b);该时间系数与春季赤道印度洋上空ψ距平场EOF第一特征向量对应的时间系数之间的相关关系也存在明显阶段性(图 15),两者在1981~2010年存在显著正相关,而在1951~1980年则不存在显著相关。前文4.2小节已经提到,赤道印度洋纬向—垂直环流的中心位置在1981~2010年有向东移动的趋势,本节也指出Walker环流的中心位置随着时间变化向西移动,综合以上可以提出假设:是否由于赤道印度洋纬向—垂直环流与Walker环流中心位置的靠拢,加强了两者上升支的耦合,使得1981~2010年间两者强度的年际变化出现了显著正相关?关于这一点还有待进一步分析研究。
|
图 14 春季赤道太平洋上空纬向质量通量流函数(ψ)距平场的(a)EOF 第一特征向量的空间分布(粗等值线)及(b)对应的标准化时间系数(点 实线)。(a)中细等值线为多年平均的ψ,等值线间距为5×10¹⁰ kg s−1;(b)中倾斜直线为时间系数的线性回归,趋势标注在图右下角,星号表示通过95%的信度检验;虚线为时间系数的11 年滑动平均 Figure 14 (a) The first EOF mode of the spring zonal mass flux stream function (ψ) anomalies over the equatorial Pacific (thick contours) and (b) the corresponding time coefficient (solid line with dots). The thin contours in (a) indicate the long-term mean ψ with the contour interval of 5×10¹⁰ kg s−1. The inclined straight line in (b) is the fitted linear trend line of the time coefficient; the trend coefficient is labeled on the bottom right corner of the figure; the asterisk indicates a statistically significant trend at the 95% confidence level. The dashed line in (b) indicates the 11-year moving average of the time coefficient |
|
图 15 春季赤道太平洋上空纬向质量通量流函数(ψ)距平场EOF 第一特征向量对应的时间系数与春季赤道印度洋上空ψ 距平场EOF 第一特征向量对应的时间系数的15 年滑动相关系数。虚线:通过相关系数的95%信度检验 Figure 15 15-year sliding correlation coefficient between the corresponding time coefficient of the first EOF mode of the spring zonal mass flux stream function (ψ) anomaly field over the equatorial Pacific and the corresponding time coefficient of the first EOF mode of the spring ψ anomaly field over the equatorial Indian Ocean. Dashed line: 95% confidence level for the correlation coefficient |
| [1] | Bayr T, Dommenget D, Martin T, et al. 2014. The eastward shift of the Walker circulation in response to global warming and its relationship to ENSO variability[J]. Climate Dyn., 43(9-10) : 2747–2763 DOI:10.1007/s00382-014-2091-y |
| [2] | Collins M, An S I, Cai W J, et al. 2010. The impact of global warming on the tropical Pacific Ocean and El Niño[J]. Nat. Geosci., 3(6) : 391–397 DOI:10.1038/ngeo868 |
| [3] | Compo G P, Whitaker J S, Sardeshmukh P D, et al. 2011. The twentieth century reanalysis project[J]. Quart. J. Roy. Meteor. Soc., 137(654) : 1–28 DOI:10.1002/qj.776 |
| [4] | Fischer A S, Terray P, Guilyardi E, et al. 2005. Two independent triggers for the Indian Ocean dipole/zonal mode in a coupled GCM[J]. J. Climate, 18(17) : 3428–3449 DOI:10.1175/JCLI3478.1 |
| [5] | Flohn H, Fleer H. 1975. Climatic teleconnections with the equatorial Pacific and the role of ocean/atmosphere coupling[J]. Atmosphere, 13(3) : 96–109 DOI:10.1080/00046973.1975.9648391 |
| [6] | Gill A E.1982. Atmosphere-Ocean Dynamics[M]. New York: Academic Press : 662pp . |
| [7] | Hastenrath S. 2007. Circulation mechanisms of climate anomalies in East Africa and the equatorial Indian Ocean[J]. Dyn. Atmos. Oceans, 43(1-2) : 25–35 DOI:10.1016/j.dynatmoce.2006.06.002 |
| [8] | Hastenrath S, Polzin D, Mutai C. 2011. Circulation mechanisms of Kenya rainfall anomalies[J]. J. Climate, 24(2) : 404–412 DOI:10.1175/2010JCLI3599.1 |
| [9] | 何敏. 1999. 热带环流强度变化与我国夏季降水异常的关系[J]. 应用气象学报, 10(2) : 171–180. He Min. 1999. Relationship between tropical circulation intensity and summer precipitation anomaly in China[J]. Quart. J. Appl. Meteor. (in Chinese), 10(2) : 171–180 DOI:10.3969/j.issn.1001-7313.1999.02.005 |
| [11] | Held I M, Soden B J. 2006. Robust responses of the hydrological cycle to global warming[J]. J. Climate, 19(21) : 5686–5699 DOI:10.1175/JCLI3990.1 |
| [12] | Holton J R.2004. An Introduction to Dynamic Meteorology[M].4th ed. San Diego: Academic Press : 535pp . |
| [13] | Klein S A, Soden B J, Lau N C, et al. 1999. Remote sea surface temperature variations during ENSO:Evidence for a tropical atmospheric bridge[J]. J. Climate, 12(4) : 917–932 DOI:10.1175/1520-0442(1999)012<0917:RSSTVD>2.0.CO;2 |
| [14] | L'Heureux M L, Lee S, Lyon B. 2013. Recent multidecadal strengthening of the Walker circulation across the tropical Pacific[J]. Nat. Climate Change, 3(6) : 571–576 |
| [15] | Luo J J, Sasaki W, Masumoto Y. 2012. Indian Ocean warming modulates Pacific climate change[J]. Proc. Natl. Acad. Sci. U.S.A., 109(46) : 18701–18706 DOI:10.1073/pnas.1210239109 |
| [16] | Mcgregor S, Timmermann A, Stuecker M F, et al. 2014. Recent Walker circulation strengthening and Pacific cooling amplified by Atlantic warming[J]. Nat. Climate Change, 4(10) : 888–892 DOI:10.1038/nclimate2330 |
| [17] | Meng Q J, Latif M, Park W, et al. 2012. Twentieth century Walker circulation change:Data analysis and model experiments[J]. Climate Dyn., 38(9-10) : 1757–1773 DOI:10.1007/s00382-011-1047-8 |
| [18] | 孟文, 吴国雄. 2000. 赤道印度洋-太平洋地区海气系统的齿轮式耦合和ENSO事件II. 数值模拟[J]. 大气科学, 24(1) : 15–25. Meng Wen, Wu Guoxiong. 2000. Gearing between the Indo-monsoon circulation and the Pacific-Walker circulation and the ENSO. Part II:Numerical simulation[J]. Chinese Journal of Atmospheric Sciences (in Chinese), 24(1) : 15–25 DOI:10.3878/j.issn.1006-9895.2000.01.02 |
| [20] | Nagura M, Konda M. 2007. The seasonal development of an SST anomaly in the Indian Ocean and its relationship to ENSO[J]. J. Climate, 20(1) : 38–52 DOI:10.1175/JCLI3986.1 |
| [21] | Newell R E. 1979. Climate and the ocean:Measurements of changes in sea-surface temperature should permit us to forecast certain climatic changes several months ahead[J]. Amer. Sci., 67(4) : 405–416 |
| [22] | Nicholls N. 2008. Recent trends in the seasonal and temporal behaviour of the El Niño-Southern Oscillation[J]. Geophys. Res. Lett., 35(19) : L19703 DOI:10.1029/2008GL034499 |
| [23] | Nicholson S E. 2014. The predictability of rainfall over the Greater Horn of Africa[J]. Part I:Prediction of seasonal rainfall[J]. J. Hydrometeorol., 15(3) : 1011–1027 DOI:10.1175/JHM-D-13-062.1 |
| [24] | Pohl B, Camberlin P. 2006. Influence of the Madden-Julian oscillation on East African rainfall[J]. I:Intraseasonal variability and regional dependency[J]. Quart. J. Roy. Meteor. Soc., 132(621) : 2521–2539 DOI:10.1256/qj.05.104 |
| [25] | Pohl B, Camberlin P. 2011. Intraseasonal and interannual zonal circulations over the equatorial Indian Ocean[J]. Theor. Appl. Climatol., 104(1-2) : 175–191 DOI:10.1007/s00704-010-0336-1 |
| [26] | Power S B, Kociuba G. 2011. What caused the observed twentieth-century weakening of the walker circulation?[J]. J. Climate, 24(24) : 6501–6514 DOI:10.1175/2011JCLI4101.1 |
| [27] | 商树荣, 蒋尚城. 2002. 卫星双通道反演的赤道纬向环流的气候特征及与ENSO关系的研究[J]. 热带气象学报, 18(1) : 56–64. Shang Shurong, Jiang Shangcheng. 2002. The climatic characteristics of equatorial zonal circulation retrieved with dual satellite channels and its relationship with ENSO[J]. Journal of Tropical Meteorology (in Chinese), 18(1) : 56–64 DOI:10.3969/j.issn.1004-4965.2002.01.007 |
| [29] | 施能, 马丽, 袁晓玉, 等. 2001. 近50 a浙江省气候变化特征分析[J]. 南京气象学院学报, 24(2) : 207–213. Shi Neng, Ma Li, Yuan Xiaoyu, et al. 2001. Climate variation features over Zhejiang Province in the last 50 years[J]. Journal of Nanjing Institute of Meteorology (in Chinese), 24(2) : 207–213 DOI:10.3969/j.issn.1674-7097.2001.02.009 |
| [31] | Simmons A J, Uppala S, Dee D, et al. 2007. ERA-Interim:new ECMWF reanalysis products from 1989 onwards[J]. ECMWF Newslett., 110 : 25–35 |
| [32] | Smith T M, Reynolds R W, Peterson T C, et al. 2008. Improvements to NOAA's historical merged land ocean surface temperature analysis (1880-2006)[J]. J. Climate, 21(10) : 2283–2296 DOI:10.1175/2007JCLI2100.1 |
| [33] | Sohn B J, Yeh S W, Schmetz J, et al. 2013. Observational evidences of Walker circulation change over the last 30 years contrasting with GCM results[J]. Climate Dyn., 40(7) : 1721–1732 DOI:10.1007/s00382-012-1484-z |
| [34] | Tanaka H L, Ishizaki N, Kitoh A. 2004. Trend and interannual variability of Walker, monsoon and Hadley circulations defined by velocity potential in the upper troposphere[J]. Tellus A, 56(3) : 250–269 DOI:10.1111/j.1600-0870.2004.00049.x |
| [35] | Tokinaga H, Xie S P, Deser C, et al. 2012a. Slowdown of the Walker circulation driven by tropical Indo-Pacific warming[J]. Nature, 491(7424) : 439–443 DOI:10.1038/nature11576 |
| [36] | Tokinaga H, Xie S P, Timmermann A, et al. 2012b. Regional patterns of tropical Indo-Pacific climate change:Evidence of the Walker circulation weakening[J]. J. Climate, 25(5) : 1689–1710 DOI:10.1175/JCLI-D-11-00263.1 |
| [37] | Trenberth K E, Fasullo J, Smith L. 2005. Trends and variability in column-integrated atmospheric water vapor[J]. Climate Dyn., 24(7-8) : 741–758 DOI:10.1007/s00382-005-0017-4 |
| [38] | Uppala S M, Kallberg P W, Simmons A J, et al. 2005. The ERA-40 re-analysis[J]. Quart. J. Roy. Meteor. Soc., 131(612) : 2961–3012 DOI:10.1256/qj.04.176 |
| [39] | Vecchi G A, Soden B J. 2007. Global warming and the weakening of the tropical circulation[J]. J. Climate, 20(17) : 4316–4340 DOI:10.1175/JCLI4258.1 |
| [40] | Vecchi G A, Soden B J, Wittenberg A T, et al. 2006. Weakening of tropical Pacific atmospheric circulation due to anthropogenic forcing[J]. Nature, 441(7089) : 73–76 DOI:10.1038/nature04744 |
| [41] | Vecchi G A, Wittenberg A T. 2010. El Niño and our future climate:Where do we stand?[J]. Interdisciplinary Reviews Climate Change, 1(2) : 260–270 DOI:10.1002/wcc.33 |
| [42] | Wilks D S.2011. Statistical Methods in the Atmospheric Sciences. 3rd ed. Waltham:Academic Press[M]. : 669pp . |
| [43] | 吴国雄, 孟文. 1998. 赤道印度洋-太平洋地区海气系统的齿轮式耦合和ENSO事件 I. 资料分析[J]. 大气科学, 22(4) : 470–480. Wu Guoxiong, Meng Wen. 1998. Gearing between the Indo-monsoon circulation and the Pacific-Walker circulation and the ENSO. Part I:Data analyses[J]. Chinese Journal of Atmospheric Sciences (in Chinese), 22(4) : 470–480 DOI:10.3878/j.issn.1006-9895.1998.04.09 |
| [45] | Xie S P, Du Y, Huang G, et al. 2010. Decadal shift in El Niño influences on Indo-Western Pacific and East Asian climate in the 1970s[J]. J. Climate, 23(12) : 3352–3368 DOI:10.1175/2010JCLI3429.1 |
| [46] | Yu B, Boer G. 2002. The roles of radiation and dynamical processes in the El Niño-like response to global warming[J]. Climate Dyn., 19(5-6) : 539–554 DOI:10.1007/s00382-002-0244-x |
| [47] | Yu B, Zwiers F W. 2010. Changes in equatorial atmospheric zonal circulations in recent decades[J]. Geophys. Res. Lett., 37(5) : L05701 DOI:10.1029/2009GL042071 |
| [48] | Zhang M H, Song H. 2006. Evidence of deceleration of atmospheric vertical overturning circulation over the tropical Pacific[J]. Geophys. Res. Lett., 33(12) : L12701 DOI:10.1029/2006GL025942 |
 2017, Vol. 41


