2 中国气象局国家气候中心, 北京 100081
3 中国科学院大气物理研究所气候变化研究中心, 北京 100029
4 中国科学院大学, 北京 100049
5 盖州市气象局, 盖州 115200
2 National Climate Center, China Meteorological Administration, Beijing 100081
3 Climate Change Research Center, Institute of Atmospheric Physics, Chinese Academy of Sciences, Beijing 100029
4 University of Chinese Academy of Sciences, Beijing 100049
5 Gaizhou Meteorological Bureau, Gaizhou 115200
全球和区域尺度的气候模式,是进行气候变化模拟和预估研究的首要工具,但受气候系统复杂性和科学发展水平的制约,他们对当代气候的模拟与观测相比,也总是存在或多或少的偏差,包括在平均态和概率密度分布等多方面。
在使用气候模式进行气候变化预估研究时,大家一般更多关注未来的气候变化信号,对于模式本身模拟的偏差关注相对较少,而且有分析认为,模式预估的未来气候变化结果,受当代气候模拟偏差影响较小(Giorgi and Coppola, 2010)。但在将气候模式结果应用于驱动,如水文和农业等影响评估模式时,其偏差则会对模拟产生很大影响,需要进行订正工作(Ines and Hansen, 2006; Baigorria et al., 2007; Christensen et al., 2008; Yang et al., 2010b; Piani et al., 2010a, 2010b)。误差订正(bias correction)在国际上有较广泛地开展和应用,它有时也被归入统计降尺度的范围,或被称为模式输出统计法(Model Output Statistics, MOS)、统计转换(statistical transformation)等(Maraun et al., 2010; Gudmundsson et al., 2012)。现在随着对气候变化影响评估和脆弱性及风险研究的深入,这一问题也得到了越来越多的重视(IPCC, 2015)。近年来,国内也有相关研究的开展,其中,如宋艳玲(2007)对RegCM3区域模式,刘绿柳和任国玉(2012)对多个全球模式,周林等(2014a, 2014b)对PRECIS区域模式,及陶苏林等(2016)对RegCM4区域模式结果的订正等,使气候模式结果更好的应用于影响评估领域。此外陈杰等(2016)在对统计降尺度方法所进行的综述中,也对此问题有所涉及。
对气候模式结果进行误差订正的方法有很多,其中最简单的就是扰动法(perturbation method)或称delta方法,即以观测作为当代气候,将气候变化信号或直接(对于气温)或按照比例(对于降水)叠加到观测上作为未来气候,国内如石英等(2010)使用此方法,对未来华北地区高温变化进行了分析。扰动法简便易行,但一般仅适用于对平均态的订正上,较难应用于日尺度数据的处理,且不能对概率分布方面的误差进行订正。
目前较常用的方法是基于概率分布的订正,即分位数映射(Quantile-Mapping, QM)方法,在选定的参照时段内,分别计算观测和模拟值的累积概率分布函数(Cumulative Distribution Function, CDF),构建两者之间的传递函数(Transfer Function, TF)。然后利用传递函数,订正其他时段内模拟值的CDF,最终达到降低模式模拟误差的目的(详见下文2.2节)。在本文中,即通过分位数映射方法,对一个区域气候模式(RegCM4.4)所模拟的逐日降水结果进行订正。首先通过与观测资料的对比,检验了所建立的不同传递函数对降水的气候平均态和分布的订正效果;随后选取其中较好的一种方法,对订正结果进行了更深入的分析。
2 模式、数据与方法 2.1 模式和数据相比全球模式,区域气候模式由于其更高的分辨率,可以在很大程度上提高对中国和东亚地区气候的模拟能力,特别是在季风降水方面(Gao et al., 2001, 2012, 2013; 许吟隆和Jones, 2004; Yu et al., 2010; Zou and Zhou, 2013)。由位于意大利的国际物理中心(The Abdus Salam International Center for Theoretical Physics, ICTP)所发展的RegCM系列模式,在东亚和中国地区有广泛的应用(Gao and Giorgi, 2017)。最近Gao et al.(2017)使用其新版的RegCM4.4(Giorgi et al., 2012),在ERA-Interim再分析资料(Simmons et al, 2007)驱动下,进行了1990~2010年的长期积分模拟。模拟采用国际联合区域气候降尺度试验(COordinated Regional climate Downscaling Experiment, CORDEX; Giorgi et al., 2009)第二阶段所推荐的东亚区域,覆盖中国大陆、蒙古、韩国和日本及其周边,水平分辨率为25 km。Gao et al.(2017)曾对此模拟进行了较深入的检验和分析。同样为了与观测比较,本文中使用双线性插值方法,将模式结果插值到0.25°×0.25°的经纬度上。
用于模式结果订正的降水观测资料,来自中国区域格点化观测数据集CN05.1,其水平分辨率为0.25°×0.25°,该数据集是基于2400余个中国地面气象台站观测,通过“距平逼近”方法插值建立的(吴佳和高学杰,2013)。该数据集及其早期版本CN05(Xu et al., 2009)在气候模式的检验和当代气候变化分析等多个方面有广泛的应用(Yang et al., 2010a; 田芝平和姜大膀, 2013; 董思言等, 2014; 华文剑等, 2015; Zhou et al., 2015; Wu et al., 2017)。
2.2 分位数订正方法及传递函数的建立和选取分位数映射方法应用时,所需传递函数的建立方法主要有两种。一种是基于理论概率分布函数,即假定模式模拟与观测结果已经符合已知的概率分布函数,如假定降水符合Gamma或Gamma-Bernoulli混合分布、气温符合正态分布等(Piani et al., 2010a; Gudmundsson et al., 2012; Teutschbein and Seibert, 2012; Chen et al., 2013; 周林等, 2014a, 2014b)。但有研究表明,这种方法对降水极值的订正效果较差,另外如当观测和模式降水数据不满足Gamma分布时,订正效果会不明显(Lafon et al., 2013; Li et al., 2014)。另一种是基于经验概率分布建立传递函数,即订正模式模拟降水的经验累积概率分布(Wood et al., 2002, 2004; Ashfaq et al., 2010; Themeßl et al., 2012)。按照传递函数构造方法的不同,还可以进一步分为参数转换和非参数转换。参数转换是将传递函数用线性或非线性参数模型表示(Lenderink et al., 2007; Piani et al., 2010b; Teutschbein and Seibert, 2012)。参数转换对于模式模拟的误差有较好的改善效果(Dosio and Paruolo, 2011)。但它也存在一定的局限性,如建立线性参数模型的方法虽然不易受验证时段选取的影响(Leander and Buishand, 2007),但是该方法对模式模拟的订正效果较差。使用指数公式建立参数模型,以订正模式与观测之间的经验累积概率分布时,当两者之间恰好满足指数关系的情况下效果较好,若不满足则较差。相比而言,采用非参数转换的方法来建立传递函数的适用性更广泛(Boé et al., 2007),因为它不需要对原始数据做前提假设。
在气候模式模拟的降水中,一般存在毛毛雨日数偏多的现象,在对降水日数进行订正时,可以直接将模式中小于0.1 mm d-1的降水赋值为0(Piani et al., 2010a)。我们采用的方法是将模式结果中的日降水量由大到小排序,达到观测的降水日数后,剩余的降水(一般也在0.1 mm d-1左右)则赋值为0,最终得到新的日降水量序列。订正以季节为单位进行,全年划分为冬(12~2月)、春(3~5月)、夏(6~8月)和秋(9~11月)四个季节进行。将1990年12月1日至2000年11月31日共计10年(参照时段)的观测资料与模式的输出资料分季节建立传递函数:
| $ {x_{{\rm{bc}}}} = F({x_{\rm{m}}}), $ | (1) |
其中,F为传递函数,xm为模式的原始输出值,xbc为订正值。将建立好的传递函数应用于2000年12月1日至2010年11月31日模式降水数据的订正(验证时段),得到订正后的10年日降水序列。
本文使用6种不同的参数和非参数方法来建立传递函数,方法如下:
(1)参数传递函数PTFe。在参照时段中利用公式:
| $ {P_{\rm{o}}} = (a + b{P_{{\rm{m1}}}})\left[ {1 - \exp (- {P_{{\rm{m1}}}}/\tau)} \right] $ | (2) |
建立传递函数。其中,Po和Pm1分别是参照时段的观测数据经验累积分布和模式数据经验累积分布,a、b和τ为系数。采用最小二乘法可得出所需各参数,应用到验证时段中,即:
| $ {P_{{\rm{bc}}}} = (a + b{P_{{\rm{m2}}}})\left[ {1 - {\rm{exp}}(- {P_{{\rm{m2}}}}/\tau)} \right], $ | (3) |
其中,Pbc为订正后的经验累积分布,Pm2是验证时段的模式数据的经验累积分布。
(2)参数传递函数PTFl。与方法(1)类似,但利用下述公式计算系数:
| $ {P_{\rm{o}}} = a + b{P_{{\rm{m1}}}}. $ | (4) |
(3)参数传递函数PTFp。与方法(1)类似,但利用下述公式计算系数:
| $ {P_{\rm{o}}} = bP_{{\rm{m1}}}^{\rm{c}}. $ | (5) |
(4)非参数转换QUANT。在参照时段中使原始输出数据的经验累积概率分布函数尽可能与观测相近,即:
| $ {F_{{\rm{cdfm}}1}}({x_{m1}}) = {F_{{\rm{cdfo}}}}({x_o}). $ | (6) |
将建立的传递函数应用到验证时段中,即:
| $ {F_{{\rm{cdfo}}}}({x_{{\rm{bc}}}}) = {F_{{\rm{cdfm2}}}}({x_{{\rm{m2}}}}), $ | (7) |
从而得到订正后的数据xbc。其中,xm1、Fcdfm1和xm2、Fcdfm2分别为参照时段和验证时段的模式数据及其对应的经验CDF,Xo、Fcdfo分别为观测数据及其对应的经验CDF。在拟合传递值之间的插值类型选择的是单调三次样条插值方法。
(5)非参数转换RQUANT。该方法与QUANT类似,所不同的是使用局部线性最小二乘回归对模式与观测的经验CDF进行拟合,拟合传递值之间的插值类型选择线性插值。
(6)非参数转换SSPLIN。该方法与QUANT类似,所不同的是使用三次光滑样条拟合观测与模式数据之间的分位数关系,其中样条曲线的光滑参数用广义交叉验证的方法确定。
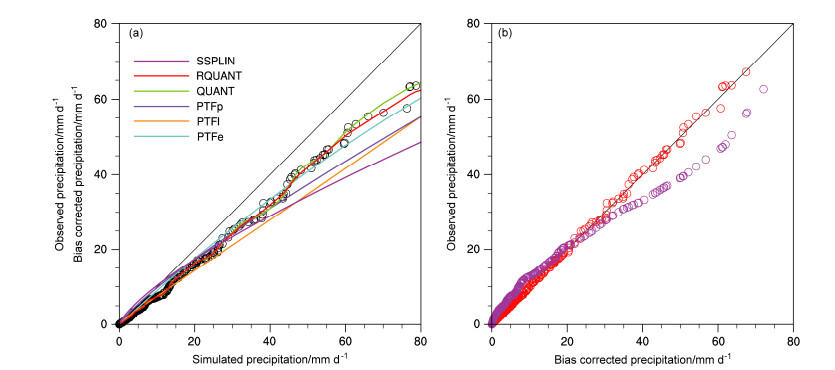
为了更加直观地说明误差订正过程中传递函数的建立,以一个北京地区的格点(39.75°N,116.25°E)夏季降水为例,分别给出了以上6种方法得到的传递函数及部分订正结果,如图 1所示。图 1a中黑色圆点显示了日降水量的模式原始输出值与观测值的比较,可以看到模拟值的误差显著偏大。以QUANT方法为例,首先将观测与模式的日降水量从小到大进行排序,均匀的分为100个区间,分别建立各自的CDF;然后对每一区间的CDF进行插值拟合,就可以建立传递函数(图 1a中的绿色线);最后将传递函数应用到验证时段中,即横轴的模式数据在绿色曲线上寻找对应的纵轴值,即是最终得到的订正值。非参数方法RQUANT(红色线)与该方法类似,但插值类型不同;SSPLIN方法(粉色线)则对100个区间的CDF使用三次光滑样条进行拟合。而三种参数传递函数的方法(PTFe、PTFl、PTFp),则在排序后的观测与模式之间拟合计算相应公式的系数,将得到的系数组成的函数定义为传递函数,而后应用到验证时段中得到订正值。图 1b中以RQUANT和SSPLIN为例,给出了订正结果与观测的对比,可以看到在北京地区夏季,前者的订正效果好于后者。
|
图 1 基于格点(39.75°N,116.25°E)的夏季日降水量建立的传递函数及订正结果:(a)观测结果及6种方法所建立的传递函数,横坐标为模式原始输出值,黑色圆圈对应的纵坐标为观测值,各曲线对应的纵坐标为订正值;(b)RQUANT方法(红色)和SSPLIN方法(紫色)的订正结果,横坐标为订正值,纵坐标为观测值 Figure 1 Transfer functions and simulated/bias corrected precipitation at grid point (39.75°N, 116.25°E) in JJA: (a) The observations and transfer functions of six methods; (b) the bias corrected precipitation by RQUANT (red) and SSPLIN (purple) methods. In Fig. a, the x-axis represents simulations, and y-axis represents observations for the black circles and bias corrected simulations for the curves. In Fig. b, the x-and y-axis represent simulation and observation, respectively |
本文中的计算由基于R语言的软件包qmap(Gudmundsson et al., 2012;http://cran.r-project.org/web/packages/qmap/index.html[2016-10-30])进行。
2.3 分析方法将经订正的验证时段(2000年12月至2010年11月)结果与观测进行对比,检验在参照时段所建立的传递函数是否有效地应用到了其他时段上。为简明起见,文中主要给出冬季(DJF)和夏季(JJA)两个季节的订正效果,使用平均绝对误差(MAE)和均方根误差(RMSE)两个指标进行,其定义分别为
| $ {r_{{\rm{MAE}}}} = \frac{1}{n}\sum\limits_{i = 1}^n {\left| {{y_i} - \left. {{x_i}} \right|{\rm{ }}} \right.}, $ | (8) |
| $ {r_{{\rm{RMSE}}}} = \sqrt {\frac{1}{n}\sum\limits_{i = 1}^n {{{({y_i} - {x_i})}^2}} } {\rm{ }}, $ | (9) |
其中,yi为某格点上的模拟值或订正值,xi为某格点上的观测值,n为格点数。
除平均场外,同时将降水按照降水量的百分位,分成了10个等级,分别为小于10%、10%~20%、20%~30%、30%~40%、40%~50%、50%~60%、60%~70%、70%~80%、80%~90%、和大于90%,以对分布情况进行检验。
对降水年际变率的分析和检验使用变异系数(CV),定义为
| $ {C_{\rm{V}}} = \frac{{\sqrt {\frac{1}{n}\sum\limits_{i = 1}^n {{{({X_i} - \bar X)}^2}} } }}{{\bar X}}{\rm{ }}, $ | (10) |
其中,Xi为某格点上各年的观测值、模拟值或订正值,X代表该格点上观测、模拟或订正的多年平均值,n为年数。
对极端事件的分析,采用了连续干旱日数(CDD)和强降水指数(SDII)两个指标,其中CDD定义为年内日降水量小于1 mm的最大连续日数,SDII定义为年总降水量除以降水日数(日降水量大于1 mm)。
3 结果 3.1 不同误差订正方法的比较验证时段模式模拟和使用不同方法订正的各格点降水,与同期观测值的MAE和RMSE的区域平均值,在表 1中给出。可以看到,各种方法对平均降水的订正效果都很好,MAE和RMSE在冬季的误差一般都减少90%左右,夏季减少75%以上,其中效果更明显一些的是PTFl和RQUANT方法。
| 表 1 验证时段(2000年12月至2010年11月)中,中国区域平均的冬、夏季降水量的模式模拟结果和不同订正方法结果与观测间的绝对误差(MAE)和均方根误差(RMSE) Table 1 MAEs (Mean absolute errors) and RMSEs (root mean square errors) in the simulated and bias corrected precipitation by different methods compared to observations in DJF (December, January, February) and JJA (June, July, August) during the validation period (from December 2000 to November 2010) over China |
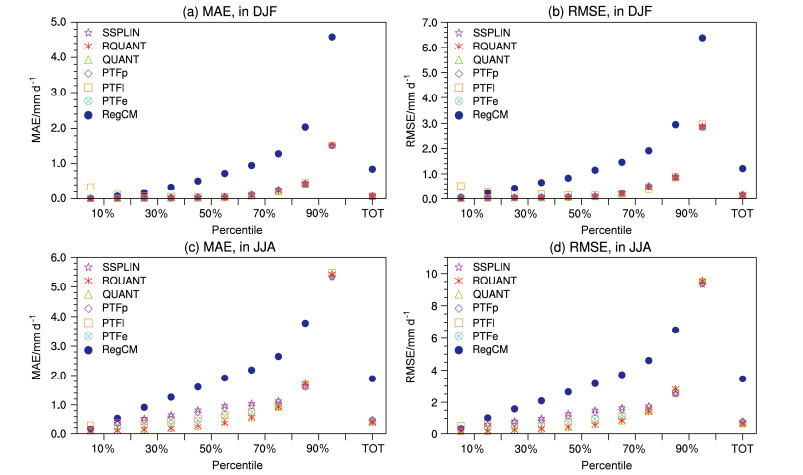
图 2给出中国区域平均的不同降水百分位区间、模式模拟和6种订正方法的结果与观测数据的误差情况。由图中可以看出,总体而言,各种方法对模式模拟的偏差均有很好的订正效果,但误差随降水强度的增加而增大,在大于90%的区间误差增加明显,但由于高段降水对总降水量的贡献相对较小,总降水量的订正效果仍然较好。具体在冬季,除PTFl稍差,特别是在小于10%的低段外,其他方法差别不大(图 2a、b)。夏季的订正效果,PTFl同样在低段较差,而QUANT和RQUANT对中段降水(10%~70%)的订正效果则明显更好一些(图 2c、d)。
|
图 2 验证时段中,中国区域平均的冬、夏季不同百分位数区段(0~100%)及总降水量(TOT)的模拟和不同订正方法结果与观测数据的MAE及RMSE:(a)冬季MAE;(b)冬季RMSE;(c)夏季MAE;(d)夏季RMSE。MAE和RMSE在夏季90%~100%区段的模式模拟值9.4和16.0,因超出现有纵坐标范围而未给出 Figure 2 The mean MAE and RMSE in the simulated and bias corrected precipitation by different methods compared to observations in DJF and JJA for different percentiles (0–100%) and the total (TOT): (a) MAE in DJF; (b) RMSE in DJF; (c) MAE in JJA; (d) RMSE in JJA. The MAE and RMSE of the model simulation for 90%–100% (9.4 and 16.0, respectively) are not shown due to the values exceeding y-axis range |
综合表 1的平均态和图 2的各百分位区间的结果来看,在各种方法均有较好的订正效果的同时,RQUANT相对表现更为突出一些,此方法则被本文选取和推荐作为中国降水的合适订正方法,并在下文中对其订正结果给出进一步的分析。
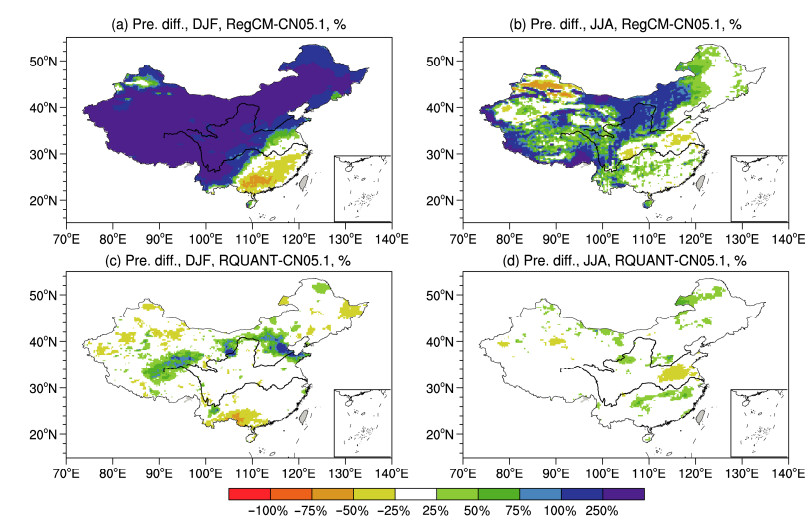
3.2 RQUANT方法的订正结果 3.2.1 平均降水图 3和图 4给出验证时段中国地区冬、夏季降水的观测、模式模拟和订正后的结果及偏差的百分率分布。由图 3中可以看到,区域模式基本能够再现我国冬、夏降水观测中呈现的东南多,西北少,降水量由东南向西北递减的主要特征,相对而言,区域模式对夏季降水的模拟更好一些。

|
图 3 验证时段中,中国地区的平均降水量(单位:mm):(a)冬季观测;(b)夏季观测;(c)冬季模拟;(d)夏季模拟;(e)冬季订正后结果;(f)夏季订正后结果 Figure 3 Mean precipitation over China during the validation period: (a) Observations in DJF; (b) observations in JJA; (c) simulation in DJF; (d) simulation in JJA; (e) simulation after bias correction in DJF; (f) simulation after bias correction in JJA |
|
图 4 验证时段中,中国地区平均降水量的相对偏差:(a)冬季模式模拟;(b)夏季模式模拟;(c)冬季订正结果;(d)夏季订正结果 Figure 4 Relative biases of mean precipitation over China during the validation period: (a) Simulation in DJF; (b) simulation in JJA; (c) bias correction in DJF; (d) bias correction in JJA |
冬季降水的主要偏差表现为观测中的东南沿海降水中心模拟偏少,而在西南地区偏多(图 3c、图 4a),这也是很多气候模式存在的普遍问题,此外RegCM系列模式还存在对北方降水模拟整体偏多的误差(Gao and Giorgi, 2017; Gao et al., 2017)。经过RQUANT方法订正后的结果(图 3e)与观测(图 3a)的分布和数值则非常相似,大大减少了模式的模拟误差,除华北至河套和青藏高原西北部存在小范围的正偏差外,其他地区的相对误差都在-25%~25%之间(图 4c)。区域模式模拟的夏季降水,在东部误差较小,在内蒙古中西部及以南和青藏高原等地偏多(图 4b)。订正后的结果同样很好地改善了上述偏差(图 3f),大部分地区的相对误差在-25%~25%间(图 4d)。冬、夏季降水模拟与观测的空间相关系数,由订正前的0.28和0.62,分别提高到了0.98和0.97,订正效果非常明显(表 2)。
| 表 2 模拟结果订正前后的冬、夏季平均降水量、CV及CDD、SDII指数与观测的空间相关系数 Table 2 Spatial correlation coefficients of simulated mean precipitation, CV (coefficient variation) in DJF and JJA, CDD (consecutive dry days), SDII (simple daily intensity index) indexes before and after bias correction with observations |
同时注意到,由于观测资料的不确定性,订正消除了模式模拟中西北地区高山上(天山和昆仑山等)存在的明显降水带,而实际上这些地区是存在降水高值的(吴佳等, 2011),同样的问题出现在西藏的雅鲁藏布江大峡谷地区(Gao et al., 2017),反映了误差订正对观测资料的高度依赖性,这也是模式订正结果应用中需要注意的问题。
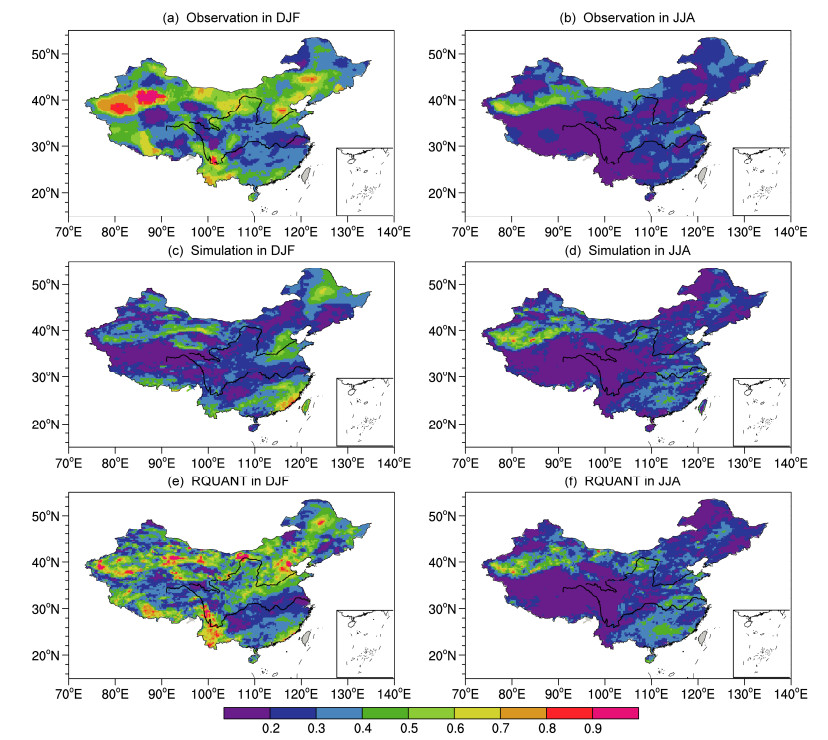
3.2.2 年际变率图 5给出验证时段中,中国区域冬、夏季降水的变异系数(CV)分布。从图中可以看到,冬季观测中的CV数值较大,除部分地区外,一般都在0.3以上。模式基本能够再现观测中CV的分布,如东部的华南沿海和华北地区偏大、长江下游偏小等特征,但整体存在低估现象(图 5a、5c)。订正后的结果(图 5e)则对上述偏差有很大的改善,除个别地区(如西北塔里木盆地的大值区等)外,均和观测非常接近,相关系数由订正前的0.20提高到0.53(表 2)。夏季观测的CV值(图 5b)明显小于冬季,同时和平均降水类似,夏季的模式模拟情况好于冬季(空间相关系数为0.63)(图 5d),订正效果也相对不明显一些。个别地区,如华南沿海等地还出现订正后的值与观测差别更大的现象。订正前后的空间相关系数分别为0.63和0.65(表 2)。
3.2.3 极端事件以CDD和SDII为例,分析极端事件的订正效果,图 6给出了他们的观测、模式模拟和订正后的结果。由于模式模拟的冬季北方降水偏多,相应的CDD也存在明显偏短的现象,模拟与观测的空间相关系数为0.40;而经过误差订正后,CDD的分布已与观测非常接近,如大幅度增加了北方地区的数值等,相关系数则提高到0.94(图 6a、6c、6e和表 2)。同时注意到,模式模拟中四川盆地的CDD值整体较观测低,但经订正后在个别地方出现了偏高。
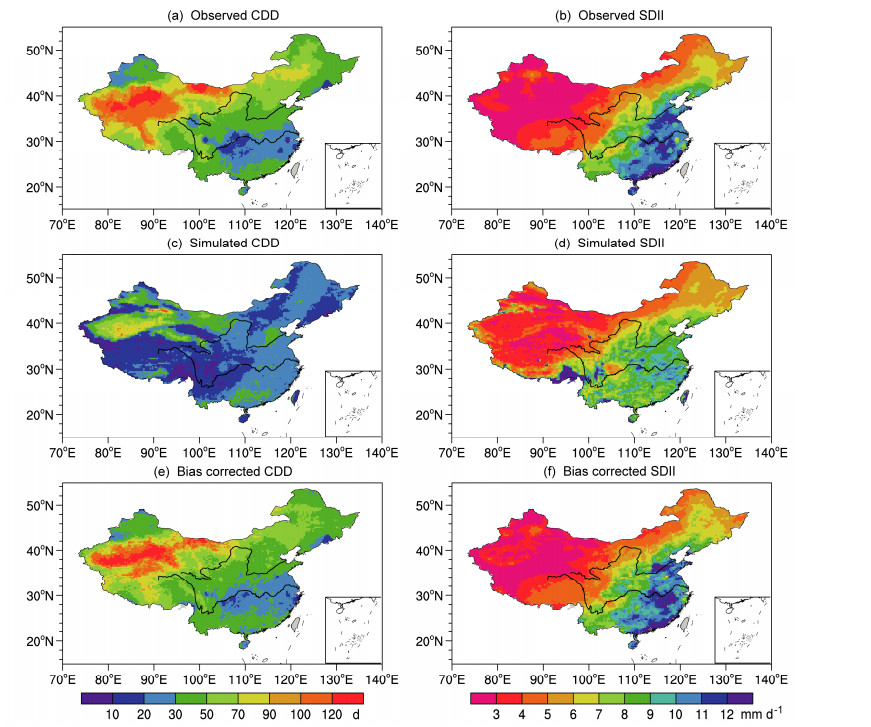
|
图 6 验证时段中,中国地区的连续干旱日数(CDD,单位:d)和强降水指数(SDII,单位:mm d-1)分布:(a)观测的CDD;(b)观测的SDII;(c)模式模拟的CDD;(d)模式模拟的SDII;(e)订正后的CDD结果;(f)订正后的SDII结果 Figure 6 The maximum number of consecutive dry days (CDD, units: d) and simple daily intensity index (SDII, units: mm d-1) over China during the validation period: (a) CDD from observations, (b) SDII from observations, (c) CDD from simulation, (d) SDII from simulation, (e) CDD after the bias correction, (f) SDII after the bias correction |
和大部分气候模式结果类似,RegCM4模拟的中国区域极端降水事件偏少,如观测中的SDII(图 6b)在东部季风区一般大于10 mm d-1,而模式模拟值则在7~10 mm d-1之间(图 6d)。经过误差订正后的SDII,无论是分布还是数值,均与观测一致(图 6e),空间相关系数由订正前的为0.62提高到0.98(表 2)。
4 结论和讨论为更好地将气候模式的模拟结果应用于气候变化影响评估模型中,本文通过基于概率分布建立传递函数的方法,对RegCM4模拟输出的日降水数据进行订正,比较了不同种订正方法的效果,对其中表现较好的RQUANT方法进行了更深入的分析,主要结论和讨论如下:
(1)不同误差订正方法对于平均降水均有很好的订正效果,使得模式模拟与观测值之间的误差大大缩小。各方法对不同百分位区间的降水也都有较好的订正效果,但订正效果在高段降水较差,未来需要对这一区段单独进行订正。
(2)在各种方法中,RQUANT相对更好一些,除平均降水外,同时有效地改进了模式对年际变率和极端事件的模拟结果。
(3)在使用误差订正方法时,应注意观测资料的可靠性,在一些因为缺少台站观测或观测误差较大的地区,应用误差订正可能会取得不好的结果。
最后需要指出的是,误差订正并不能改善和增加模式技巧,未来气候模式模拟偏差的减少仍需依赖于其本身的完善和进步。在下一步工作中,我们将检验RQUANT对降水以外的其他变量如气温等的订正效果,最后将此方法应用于所进行的气候变化模拟预估中,最终为影响评估研究和风险分析提供更适用及可靠的数据。
Ashfaq M, Bowling L C, Cherkauer K, et al. 2010. Influence of climate model biases and daily-scale temperature and precipitation events on hydrological impacts assessment:A case study of the United States [J]. J. Geophys. Res., 115(D14): D14116. DOI:10.1029/2009JD012965
|
Baigorria G A, Jones J W, Shin D W, et al. 2007. Assessing uncertainties in crop model simulations using daily bias-corrected regional circulation model outputs [J]. Climate Res., 34(3): 211-222. DOI:10.3354/cr00703
|
Boé J, Terray L, Habets F, et al. 2007. Statistical and dynamical downscaling of the Seine basin climate for hydro-meteorological studies [J]. Int. J. Climatol., 27(12): 1643-1655. DOI:10.1002/joc.1602
|
Chen J, Brissette F P, Chaumont D, et al. 2013. Finding appropriate bias correction methods in downscaling precipitation for hydrologic impact studies over North America [J]. Water Resour. Res., 49(7): 4187-4205. DOI:10.1002/wrcr.20331
|
陈杰, 许崇育, 郭生练, 等. 2016. 统计降尺度方法的研究进展与挑战[J]. 水资源研究, 5(4): 299-313. Chen Jie, Xu Chongyu, Guo Shenglian, et al. 2016. Progress and challenge in statistically downscaling climate model outputs (in Chinese)[J]. Journal of Water Resources Research, 5(4): 299-313. DOI:10.12677/JWRR.2016.54037
|
Christensen J H, Boberg F, Christensen O B, et al. 2008. On the need for bias correction of regional climate change projections of temperature and precipitation [J]. Geophys. Res. Lett., 35(20): L20709. DOI:10.1029/2008GL035694
|
董思言, 熊喆, 延晓冬. 2014. RIEMS2.0模式提高分辨率对中国气温模拟能力的影响[J]. 气候与环境研究, 19(5): 627-635. Dong Siyan, Xiong Zhe, Yan Xiaodong. 2014. Influence of increasing RIEMS2.0 model's resolution on mean air temperature over China (in Chinese)[J]. Climatic and Environmental Research, 19(5): 627-635. DOI:10.3878/j.issn.1006-9585.2013.13088
|
Dosio A, Paruolo P. 2011. Bias correction of the ENSEMBLES high-resolution climate change projections for use by impact models:Evaluation on the present climate [J]. J. Geophys. Res., 116(D16): D16106. DOI:10.1029/2011JD015934
|
Gao X J, Giorgi F. 2017. Use of the RegCM system over East Asia:Review and perspectives[J]. Egineering, in press.
|
Gao X J, Zhao Z C, Ding Y H, et al. 2001. Climate change due to greenhouse effects in China as simulated by a regional climate model [J]. Adv. Atmos. Sci., 18(6): 1224-1230. DOI:10.1007/s00376-001-0036-y
|
Gao X J, Shi Y, Zhang D F, et al. 2012. Uncertainties in monsoon precipitation projections over China:Results from two high-resolution RCM simulations [J]. Climate Res., 52: 213-226. DOI:10.3354/cr01084
|
Gao X J, Wang M L, Giorgi F. 2013. Climate change over China in the 21st century as simulated by BCC_CSM1.1-RegCM4.0 [J]. Atmos. Oceanic Sci. Lett., 6(5): 381-386. DOI:10.3878/j.issn.1674-2834.13.0029
|
Gao X J, Shi Y, Han Z Y, et al. 2017. Performance of RegCM4 over major river basins in China [J]. Adv. Atmos. Sci., 34(3): 441-455. DOI:10.1007/s00376-016-6179-7
|
Giorgi F, Jones C, Asrar G R. 2009. Addressing climate information needs at the regional level:The CORDEX framework [J]. WMO Bull., 58(3): 175-183.
|
Giorgi F, Coppola E. 2010. Does the model regional bias affect the projected regional climate change? An analysis of global model projections [J]. Climatic Change, 100(3-4): 787-795. DOI:10.1007/s10584-010-9864-z
|
Giorgi F, Coppola E, Solmon F, et al. 2012. RegCM4:Model description and preliminary tests over multiple CORDEX domains [J]. Climate Res., 52: 7-29. DOI:10.3354/cr01018
|
Gudmundsson L, Bremnes J B, Haugen J E, et al. 2012. Technical note:Downscaling RCM precipitation to the station scale using statistical transformations-A comparison of methods [J]. Hydrology and Earth System Sciences, 16(9): 3383-3390. DOI:10.5194/hess-16-3383-2012
|
华文剑, 陈海山, 李兴. 2015. 未来土地利用变化影响中国区域气候的数值模拟[J]. 中国科学:地球科学, 58(7): 1034-1042. Hua Wenjian, Chen Haishan, Li Xing. 2015. Effects of future land use change on the regional climate in China (in Chinese)[J]. Science China:Earth Sciences, 58(10): 1840-1848. DOI:10.1007/s11430-015-5082-x
|
Ines A V M, Hansen J W. 2006. Bias correction of daily GCM rainfall for crop simulation studies [J]. Agricultural and Forest Meteorology, 138(1-4): 44-53. DOI:10.1016/j.agrformet.2006.03.009
|
IPCC. 2015. Workshop Report of the Intergovernmental Panel on Climate Change Workshop on Regional Climate Projections and Their Use in Impacts and Risk Analysis Studies[M]. Stocker T F, Qin D, Plattner G K, et al., Eds. Bern:University of Bern, 171pp
|
Lafon T, Dadson S, Buys G, et al. 2013. Bias correction of daily precipitation simulated by a regional climate model:A comparison of methods [J]. Int. J. Climatol., 33(6): 1367-1381. DOI:10.1002/joc.3518
|
Leander R, Buishand T A. 2007. Resampling of regional climate model output for the simulation of extreme river flows [J]. J. Hydrol., 332(3-4): 487-496. DOI:10.1016/j.jhydrol.2006.08.006
|
Lenderink G, Buishand A, van Deursen W. 2007. Estimates of future discharges of the river Rhine using two scenario methodologies:Direct versus delta approach [J]. Hydrology and Earth System Sciences, 11(3): 1145-1159. DOI:10.5194/hess-11-1145-2007
|
Li C, Sinha E, Horton D E, et al. 2014. Joint bias correction of temperature and precipitation in climate model simulations [J]. J. Geophys. Res., 119(23): 13, 153-13, 162. DOI:10.1002/2014JD022514
|
刘绿柳, 任国玉. 2012. 百分位统计降尺度方法及在GCMs日降水订正中的应用[J]. 高原气象, 31(3): 715-722. Liu Lüliu, Ren Guoyu. 2012. Percentile statistical downscaling method and its application in the correction of GCMs daily precipitation in China (in Chinese)[J]. Plateau Meteor., 31(3): 715-722.
|
Maraun D, Wetterhall F, Ireson A M, et al. 2010. Precipitation downscaling under climate change:Recent developments to bridge the gap between dynamical models and the end user [J]. Rev. Geophys., 48(3). DOI:10.1029/2009RG000314
|
Piani C, Haerter J O, Coppola E. 2010a. Statistical bias correction for daily precipitation in regional climate models over Europe [J]. Theor. Appl. Climatol., 99(1-2): 187-192. DOI:10.1007/s00704-009-0134-9
|
Piani C, Weedon G P, Best M, et al. 2010b. Statistical bias correction of global simulated daily precipitation and temperature for the application of hydrological models [J]. J. Hydrol., 395(3-4): 199-215. DOI:10.1016/j.jhydrol.2010.10.024
|
石英, 高学杰, 吴佳, 等. 2010. 华北地区未来气候变化的高分辨率数值模拟[J]. 应用气象学报, 21(5): 580-589. Shi Ying, Gao Xuejie, Wu Jia, et al. 2010. Simulating future climate changes over North China with a high resolution regional climate model (in Chinese)[J]. J. Appl. Meteor. Sci., 21(5): 580-589. DOI:10.3969/j.issn.1001-7313.2010.05.007
|
Simmons A J, Uppala S, Dee D, et al. 2007. ERA-Interim:New ECMWF reanalysis products from 1989 onwards[R]. ECMWF Newsletter No.110, ECMWF, 11pp. Reading, United Kingdom
|
宋艳玲. 2007. 现代及未来气候变化对我国冬小麦的影响[D]. 中国科学院大气物理研究所博士学位论文. Song Yanling. 2007. Effects of climate change on winter wheat in China[D]. Ph. D. dissertation, the Institute of Atmospheric Physics, Chinese Academy of Sciences. http://d.wanfangdata.com.cn/Thesis/Y1630761
|
陶苏林, 申双和, 李雨鸿, 等. 2016. 气候模拟数据订正方法在作物气候生产潜力预估中的应用——以江苏冬小麦为例[J]. 中国农业气象, 37(2): 174-187. Tao Sulin, Shen Shuanghe, Li Yuhong, et al. 2016. Application of bias correction method for simulated climate data in projection of crop climatic potential productivity-A case study of winter wheat in Jiangsu (in Chinese)[J]. Chinese Journal of Agrometeorology, 37(2): 174-187.
|
Teutschbein C, Seibert J. 2012. Bias correction of regional climate model simulations for hydrological climate-change impact studies:Review and evaluation of different methods [J]. J. Hydrol., 456(457): 12-29. DOI:10.1016/j.jhydrol.2012.05.052
|
Themeßl M J, Gobiet A, Heinrich G. 2012. Empirical-statistical downscaling and error correction of regional climate models and its impact on the climate change signal [J]. Climatic Change, 112(2): 449-468. DOI:10.1007/s10584-011-0224-4
|
田芝平, 姜大膀. 2013. 不同分辨率CCSM4对东亚和中国气候模拟能力分析[J]. 大气科学, 37(1): 171-186. Tian Zhiping, Jiang Dabang. 2013. Evaluation of the performance of low-to high-resolution CCSM4 over East Asia and China (in Chinese)[J]. Journal of Atmospheric Sciences, 37(1): 171-186. DOI:10.3878/j.issn.1006-9895.2012.12050
|
Wood A W, Maurer E P, Kumar A, et al. 2002. Long-range experimental hydrologic forecasting for the eastern United States [J]. J. Geophys. Res., 107(D20): ACL 6-1-ACL 6-15. DOI:10.1029/2001JD000659
|
Wood A W, Leung L R, Sridhar V, et al. 2004. Hydrologic implications of dynamical and statistical approaches to downscaling climate model outputs [J]. Climatic Change, 62(1-3): 189-216. DOI:10.1023/B:CLIM.0000013685.99609.9e
|
吴佳, 高学杰. 2013. 一套格点化的中国区域逐日观测资料及与其它资料的对比[J]. 地球物理学报, 56(4): 1102-1111. Wu Jia, Gao Xuejie. 2013. A gridded daily observation dataset over China region and comparison with the other datasets (in Chinese)[J]. Chinese Journal of Geophysics, 56(4): 1102-1111. DOI:10.6038/cjg20130406
|
吴佳, 高学杰, 石英, 等. 2011. 新疆21世纪气候变化的高分辨率模拟[J]. 冰川冻土, 33(3): 479-487. Wu Jia, Gao Xuejie, Shi Ying, et al. 2011. Climate change over Xinjiang region in the 21st century simulated by a high resolution regional climate model (in Chinese)[J]. Journal of Glaciology and Geocryology, 33(3): 479-487.
|
Wu J, Gao X J, Giorgi F, et al. 2017. Changes of effective temperature and cold/hot days in late decades over China based on a high resolution gridded observation dataset [J]. Int. J. Climatol. DOI:10.1002/joc.5038
|
Xu Y, Gao X J, Shen Y, et al. 2009. A daily temperature dataset over China and its application in validating a RCM simulation [J]. Adv. Atmos. Sci., 26(4): 763-772. DOI:10.1007/s00376-009-9029-z
|
许吟隆, JonesR. 2004. 利用ECMWF再分析数据验证PRECIS对中国区域气候的模拟能力[J]. 中国农业气象, 25(1): 5-9. Xu Yinlong, Jones R. 2004. Validating PRECIS with ECMWF reanalysis data over China (in Chinese)[J]. Chinese Journal of Agrometeorology, 25(1): 5-9. DOI:10.3969/j.issn.1000-6362.2004.01.002
|
Yang H L, Xu Y L, Zhang L, et al. 2010a. Projected change in heat waves over China using the PRECIS climate model [J]. Climate Res., 42(1): 79-88. DOI:10.3354/cr00860
|
Yang W, Andréasson J, Graham L P, et al. 2010b. Distribution-based scaling to improve usability of regional climate model projections for hydrological climate change impacts studies [J]. Hydrol. Res., 41(3-4): 211-229. DOI:10.2166/nh.2010.004
|
Yu E T, Wang H J, Sun J Q. 2010. A quick report on a dynamical downscaling simulation over China using the nested model [J]. Atmos. Oceanic Sci. Lett., 3(6): 325-329. DOI:10.1080/16742834.2010.11446886
|
Zhou B T, Xu Y, Wu J, et al. 2015. Changes in temperature and precipitation extreme indices over China:Analysis of a high-resolution grid dataset [J]. Int. J. Climatol., 36(3): 1051-1066. DOI:10.1002/joc.4400/abstract
|
周林, 潘婕, 张镭, 等. 2014a. 气候模拟日降水量的统计误差订正分析——以上海为例[J]. 热带气象学报, 30(1): 137-144. Zhou Lin, Pan Jie, Zhang Lei, et al. 2014a. Analysis on statistical bias correction of daily precipitation simulated by regional climate model (in Chinese)[J]. Journal of Tropical Meteorology, 30(1): 137-144. DOI:10.3969/j.issn.1004-4965.2014.01.015
|
周林, 潘婕, 张镭, 等. 2014b. 概率调整法在气候模式模拟降水量订正中的应用[J]. 应用气象学报, 25(3): 302-311. Zhou Lin, Pan Jie, Zhang Lei, et al. 2014b. Correction based on distribution scaling for precipitation simulated by climate model (in Chinese)[J]. J. Appl. Meteor. Sci., 25(3): 302-311. DOI:10.3969/j.issn.1001-7313.2014.03.007
|
Zou L W, Zhou T J. 2013. Near future (2016-40) summer precipitation changes over China as projected by a regional climate model (RCM) under the RCP8.5 emissions scenario:Comparison between RCM downscaling and the driving GCM [J]. Adv. Atmos. Sci., 30(3): 806-818. DOI:10.1007/s00376-013-2209-x
|
 2017, Vol. 41


