2 中国科学院大学, 北京 100049
3 中国气象局国家气候中心, 北京 100081
2 University of Chinese Academy of Sciences, Beijing 100049
3 National Climate Center, China Meteorological Administration, Beijing 100081
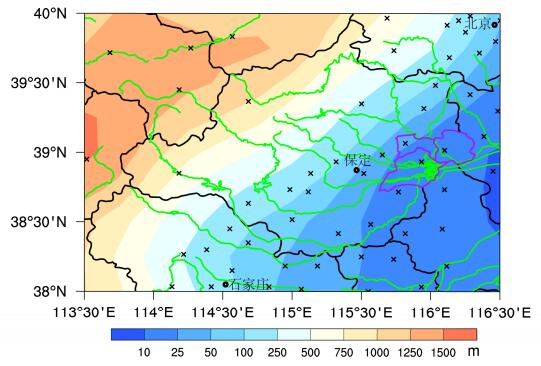
雄安国家级新区于2017年4月1日正式宣布成立,由雄县、容城县、安新县及其周边部分地区组成,地处北京、天津、保定的腹地,建设将以特定区域为起步区(面积约100平方公里)先行开发,中期发展区和远期控制区面积分别约为200和2000平方公里。雄安西部隔保定市与太行山脉相邻,位于大清河流域中,境内的白洋淀是华北第一大淡水湖(图 1),其所处的华北地区大陆性气候特点显著,四季分明,年平均气温为12℃,降水量在500 mm左右且其中2/3发生于盛夏的6~8月,属半湿润区,水资源相对紧张,在全球变暖背景下,这一地区未来气候将如何变化,是需要特别关注的问题。

|
图 1 分析区域和RegCM4中的地形分布(填色部分,单位:m)。绿色线代表各主要河流,紫色线为雄安新区的雄县、安新和容城三县,×号表示气象观测站点位置,圆点为主要城市 Figure 1 Region of interest and the topography in RegCM4 (shaded, units: m). Green lines indicate major rives, purple lines are the three counties of Xiongxian, Anxin, and Rongcheng of the Xiong'an District, × represents locations of the meteorological stations, and dots represent the major cities of the region |
一般而言,全球气候模式是进行气候变化预估的重要工具,但由于计算机资源的限制,其分辨率较低,如以在IPCC(政府间气候变化专门委员会)AR5(第五次评估报告)(IPCC, 2013)中广泛应用的耦合模式比较计划第五阶段(CMIP5)(Taylor et al., 2012)模式为例,其最高分辨率一般在1°×1°(经度×纬度)左右,每一个格点代表的面积在上万平方公里,影响其结果在区域特别是类似雄安这种局地尺度的可靠性,需要使用如区域气候模式进行降尺度。此外,研究也表明东亚地区由于其较独特的气候特点,高分辨率的区域模式对这一地区的气候有更好的模拟能力,可以得到未来气候变化更可靠的预估结果(Gao et al., 2008, 2012)。
国内研究人员近年来使用多种区域模式,在CMIP5全球模式结果驱动下开展了在RCPs(典型浓度路径)(van Vuuren et al., 2011)排放情景下,东亚和中国区域的气候变化预估模拟,分析了这一地区未来气温、降水及极端事件等的变化(Gao et al., 2013; Ji and Kang, 2013; Zou and Zhou, 2013; Guo et al., 2016; Huang et al., 2017; Zhang et al., 2017),但到目前为止,针对雄安这一特定地区的分析尚不多见,特别是在使用多个模式集合模拟方面。
本文中,我们基于在4个CMIP5全球模式驱动下,使用RegCM4区域模式所进行的东亚气候变化预估模拟结果(Gao et al., 2018),针对雄安及其周边区域,在模式模拟性能检验基础上,分析和给出了未来这一地区气候变化的预估。
2 模式、数据和方法模拟所使用的区域气候模式为RegCM4(Giorgi et al., 2012)。RegCM系列模式对东亚季风气候有较好的模拟能力,长期以来广泛应用于中国地区的当代和古气候模拟、气候机理分析,以及气候变化预估研究中,取得了大量成果(Gao and Giorgi, 2017)。相对于早期版本的RegCM模式,RegCM4的一个重要改进,是使用CLM(Oleson et al., 2008)陆面过程方案代替了原有的BATS(Dickinson et al., 1993)。Gao et al.(2016)经过对比试验,推荐RegCM4使用CLM和Emanuel对流参数化方案的组合,以取得东亚地区气候的更好模拟效果。在此基础上,Gao et al.(2017)对RegCM4中陆面参数,包括所使用植被(韩振宇等, 2015)和地表发射率(Prabhakara and Dalu, 1976;刘永强等, 2014)做进一步改进,形成一个适用于东亚地区气候模拟的推荐版本,并检验了其长期模拟效果,本文所分析的气候变化预估试验即为使用这一版本所开展的。
试验中模式与Gao et al.(2016, 2017)使用同样的模式物理过程设置,模拟范围同样选用CORDEX(区域联合降尺度计划)(Giorgi et al., 2009)的东亚区域(http://www.cordex.org/community/domain-east-asia-cordex.html [2017-09-08]),水平分辨率为25 km×25 km,垂直方向分为23层。模拟运行所需的初始场和每6小时更新一次的侧边界驱动场来自CMIP5中的4个模式,分别为CSIRO-Mk3-6-0、EC- EARTH、HadGEM2-ES和MPI-ESM-MR的历史试验和中等排放情景RCP4.5(van Vuuren et al., 2011)下的气候变化预估结果,各全球模式的相关信息和RegCM4的试验时段可参见表 1。参加CMIP5的全球模式有40多个,选用这4个模式结果的原因,一方面是资料的可获得性;另一方面,全球模式和所驱动的区域模式分辨率的差别不能太大(一般以3~5倍为宜)。Jiang et al.(2016)的分析表明,这4个模式对中国区域气候均有较好的模拟能力,以降水为例,前3者的模拟接近或略优于CMIP5 46个模式的集合平均结果,MPI-ESM-MR的模拟也优于部分其他模式。
| 表 1 用于驱动RegCM4的4个CMIP5全球气候模式信息及RegCM4的积分时间 Table 1 Information on the four CMIP5 driving models and the time periods of the RegCM4 simulations |
本文首先针对模拟结果中,雄安新区及周边地区开展分析,具体的分析区域范围(38°N~40°N,113.5°E~116.5°E)包括上游太行山区西部大清河流域各河流源地至雄安以东,以及石家庄北部至北京南部等地(图 1)。选取模拟中的1986~2005年作为当代时段、2046~2065年作为21世纪中期、2079~2098年作为21世纪末期开展研究。
用于模式检验的观测数据为CN05.1格点数据集(吴佳和高学杰, 2013),该数据集基于中国2416个气象站的观测资料制作而成,水平分辨率为0.25°×0.25°(经度×纬度),RegCM4的模拟结果也统一插值到这些格点上,以方便对比分析。CN05.1在分析区域内的气象观测站点分布参见图 1,总体而言站点在平原地区比较密集,西北部山区相对稀少。
除地面气温和降水的平均态外,选取以下3个指数进行极端事件及其变化的分析,分别为每年的日最高气温最高值(TXx)、日最低气温最低值(TNn)和日最大降水量(RX1day)(Zhang et al., 2011)。
此外,还定义了指数IWR,用于对这一地区水资源盈亏方面的初步分析:
| $ {I_{WR}} = (1 - \frac{{{P_r}}}{{{P_{ET}}}}) \times 100 $ | (1) |
(1)式中的Pr为年降水量,PET为根据Thornthwaite(1948)方法计算得到的年潜在蒸发量Pr/PET即为广泛使用的UNEP干旱指数AIu(UNEP, 1992),石英等(2010)曾使用此指数,分析了气候变化对华北地区干旱事件的影响。IWR为负值时,对应AIu的湿润区,表示水资源较丰富;IWR为正值时,表示水分的亏损,以其大小表示相对的缺水程度。
在未来变化的分析中,除给出区域模式4个模拟的集合平均值外,同时给出了4个模拟间的一致性(对平面分布)和以1个标准差表示的变化范围(对雄安和区域的平均值)。
3 模式对当代气候模拟能力检验 3.1 平均气温和降水图 2a–d中给出多模拟集合的当代年平均气温和降水的观测、模式模拟与观测的偏差分布。由图 2a可以看到,分析区域内的气温呈现出东南部平原地区较高(12.5℃以上),西北部山区较低(7.5℃以下)的分布特征;模式模拟的偏差在平原包括雄安地区较小,一般在±0.5℃间,西北部山区则存在一定的冷偏差,幅度在1℃~2℃间,并在海拔高的地方更大(图 2c)。雄安和分析区域平均的气温偏差,分别为0.1℃和-0.8℃(表 2)。

|
图 2 当代(1986~2005年)的气温和降水:(a)观测的年平均气温(单位:℃);(b)观测的年平均降水量(单位:mm);(c)年平均气温多模拟集合的偏差(单位:℃);(d)年平均降水多模拟集合的相对偏差;(e)观测(黑色)与多模拟集合(红色)的逐月平均气温(单位:℃);(f)观测(黑色)与多模拟集合(红色)的逐月平均降水量(单位:mm) Figure 2 Multi-year averaged annual temperature and precipitation in the present day (1986–2005): (a) Observed annual mean temperature (units: ℃); (b) observed annual mean precipitation (units: mm); (c) bias of ensemble mean annual temperature (units: ℃); (d) relative bias of ensemble mean annual precipitation; (e) annual cycle of monthly mean temperature from observations (black) and ensemble averages (red) (units: ℃); (f) annual cycle of monthly mean precipitation from observations (black) and ensemble averages (red) (units:mm) |
| 表 2 雄安及周边区域平均的各要素多模拟集合偏差 Table 2 The biases of the ensemble averaged present day (1986–2005) variables over Xiong'an and the surrounding region of interest |
区域内的年平均降水量一般在400~600 mm范围内(图 2b),降水量多的地方(550~600 mm)有保定北部到北京一带及石家庄西北部;区域西北角的山西地区降水量最少,在450 mm以下。模式模拟的降水在区域内普遍偏大(图 2d),其中平原地区的偏差较小(10%以内),与观测结果较接近,但西北部山区的模拟值可以达到观测的一倍以上。山区模拟偏差的原因,一方面和模式对地形降水的高估有关,另一方面和观测资料所存在不确定性有关。具体而言,山区的观测站点分布较稀疏,并且大部分位于河流谷地(图 1),不能准确反映高山上较强的降水;此外观测对冬季的固态降水(降雪)也往往由于风的缘故等有所低估,这样使得CN05.1数据可能低估了上述地区真实的降水量,使得模拟结果与其有较大的差别。雄安和分析区域平均的降水相对偏差,分别为16%和64%(表 2)。
图 2e-f为分析区域平均气温与降水观测和多模拟集合的逐月分布,由图中可以看到,模式对气温和降水的年内循环均有较好的模拟能力,如气温和降水的最低值出现在冬季,峰值出现在夏季的7月等。模拟的气温在冬半年偏差很小,夏半年较大,误差最大的为5月的2.4℃。降水则在各月均存在高估现象,其中在7月和8月,模式模拟与观测的降水量偏差值可达70 mm,但相对偏差则在冬季由于降水量很小而更大(2倍左右)。
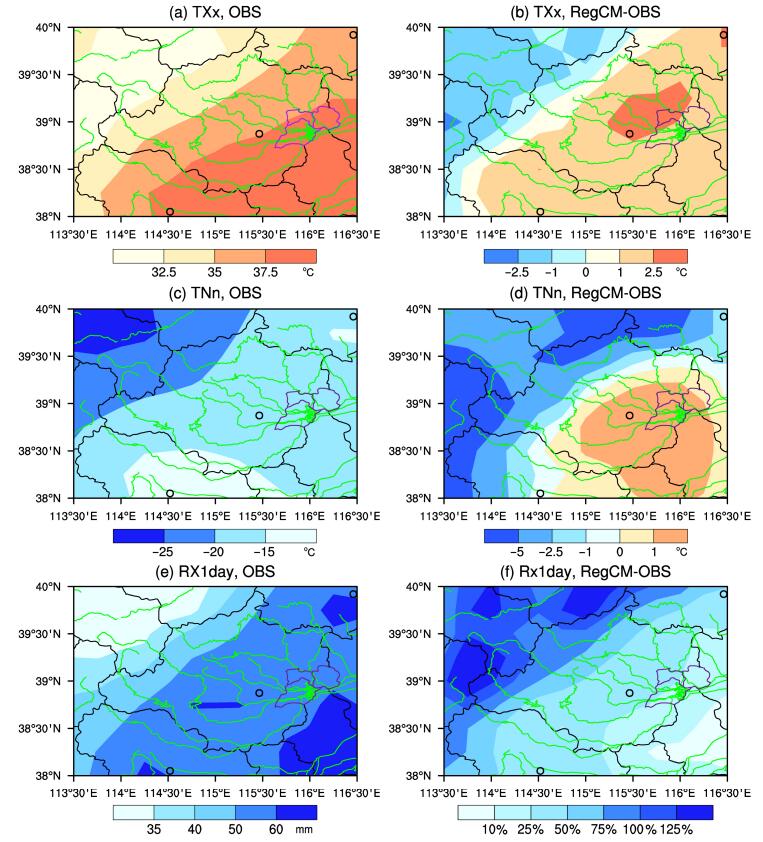
3.2 极端气温和降水指数和平均气温类似,从图 3a和c来看,观测的TXx和TNn都是在分析区域内的东南平原地区高,西北山区低。TXx的观测值在30℃至40℃之间,模式多模拟集合的偏差(图 3b)主要分布特征为在高温区偏高,低温区偏低,其中暖偏差的最大值中心在保定东北部(超过2.5℃)。TNn(图 3c)的观测值在-30℃至-10℃范围内,高值中心主要在南部的石家庄地区。TNn的模拟同样在平原地区存在暖偏差,但数值较小,一般在1℃左右;在西北部山区则有较大的冷偏差,最大在5℃以上。雄安和分析区域平均的TXx和TNn偏差分别为0.8℃和-2.3℃(表 2)。

|
图 3 当代极端事件指数的分布。观测的(a)日最高气温最高值(TXx,单位:℃)、(c)日最低气温最低值(TNn,单位:℃)、(e)日最大降水量(RX1day,单位:mm)和多模拟集合(b)TXx(单位:℃)、(d)TNn(单位:℃)、(f)RX1day的偏差 Figure 3 Spatial distributions of the climate extreme indices in the present day. Observed (a) annual maximum value of daily maximum temperature (TXx) (units: ℃), (c) annual minimum value of daily minimum temperature (TNn) (units: ℃), and (e) annual maximum 1-day precipitation (RX1day) (units: mm); and the biases of ensemble averages of (b) TXx (units: ℃), (d) TNn (units: ℃) and (f) RX1day |
从图 3e可以看出,RX1day的分布特征和平均降水(图 2b)有所不同,为平原地区数值较大,最大值中心(超过60 mm)主要位于分析区域的东南部;西北山区的数值则较小,在35 mm以下。模式模拟的RX1day相比于观测值在分析区域整体偏大,雄安和分析区域平均的偏差值分别为22%和60%(表 2),空间分布特征为在平原地区相对较小(0~50%之间),而在西北部山区较大,模拟值比观测大一倍以上。对比图 3f和图 2d,可以看到山区平均降水的高估可能主要是由对强降水事件的高估引起的。
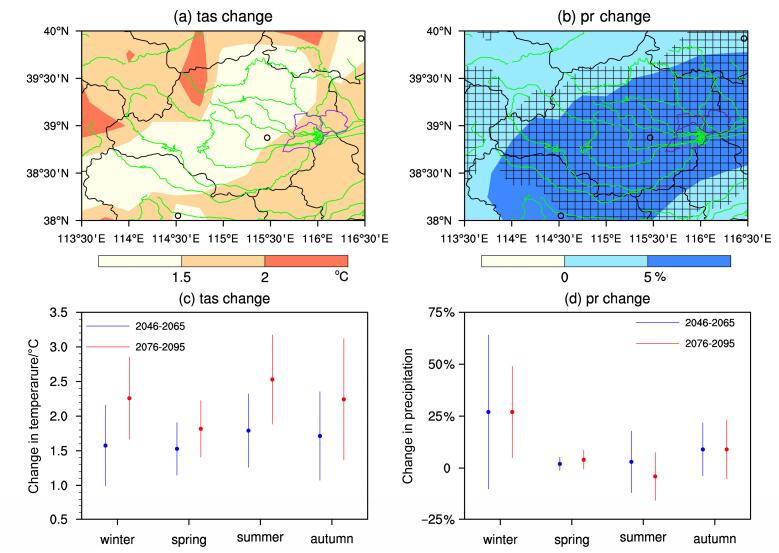
4 未来气候变化的多模拟集合预估 4.1 平均气温和降水由图 4a可以看到,在RCP4.5情景下,21世纪中期这一地区多模拟集合预估的平均气温将明显上升,其中中部的保定大部和石家庄西北部等地升温幅度稍小(1℃~1.5℃间),东南和西北部的升温相对较大(1.5℃~2℃),在西北山区部分地方的升温幅度超过2℃,雄安和分析区域平均升温值均为1.6℃(±0.5℃,1个标准差范围,下同)(表 3)。由图 4c可以看到,21世纪中期,区域平均的四季气温上升幅度相差不多,夏季稍大一些(1.8℃),4个模拟结果之间的标准差,秋季较大,春季最小,即气温的预估结果在秋季不确定性较大,春季较小。21世纪末期的气温升高更明显,同样是夏季升温值较大(2.5℃),雄安和区域的年平均升温分别为2.2℃(±0.6℃)和2.1℃(±0.6℃),同时升温值的不确定性也略大于21世纪中期。

|
图 4 多模拟集合的未来气温(单位:℃)和降水变化预估:(a)21世纪中期(2046~2065年)的年平均气温;(b)21世纪中期的年平均降水量;(c)区域平均的21世纪中期(蓝色)和末期(2079~2098年,红色)的四季气温;(d)同(c)但为降水量。图b中的“ +”表示4个模拟中的至少3个结果同符号,图c、d中的圆点为平均值,竖线表示4个模拟间的1个标准差的范围 Figure 4 The ensemble average of projected changes in temperature (units: ℃) and precipitation: (a) Annual mean temperature in the mid-21st century (2046–2065); (b) annual mean precipitation in the mid-21st century; (c) changes of temperature in the four seasons in the mid (blue) and end of the 21st century (2079–2098); (d) same as (c) but for precipitation. The "+" in (b) indicates at least 3 out of the 4 simulations agree on the sign of change, the dot and vertical lines in (c) and (d) indicates the mean and 1 standard deviation of the 4 projections |
| 表 3 雄安及周边区域平均各要素未来变化的集合模拟预估值及范围(以±1个标准差表示) Table 3 Ensemble averages of projected changes and spread (as indicated by ±1 standard deviation) of the variables over Xiong'an and the surrounding region of interest |
21世纪中期分析区域内的降水相比于当代将普遍增加,但幅度较小(图 4b),其中由西南到东北的大部分地区增加在5%(约50 mm,图略)以上,其他地区在5%以下,4个模拟间的一致性在降水增加较多地方较高。由图 4d可以看到,21世纪中期降水相对增加值在冬季最高(25%左右),但同时冬季模拟结果间的离差也较大(37%),其他季节的增加值一般在10%以内。雄安和分析区域年平均降水分别增加8%(±10%)和5%(±8%)(表 3)。和气温在21世纪的持续增加不同,21世纪末期降水量的变化并不明显,其中作为主要降水季节的夏季甚至出现减少现象,使得雄安和分析区域平均降水增加均仅为1%(±8%)左右(表 3)。
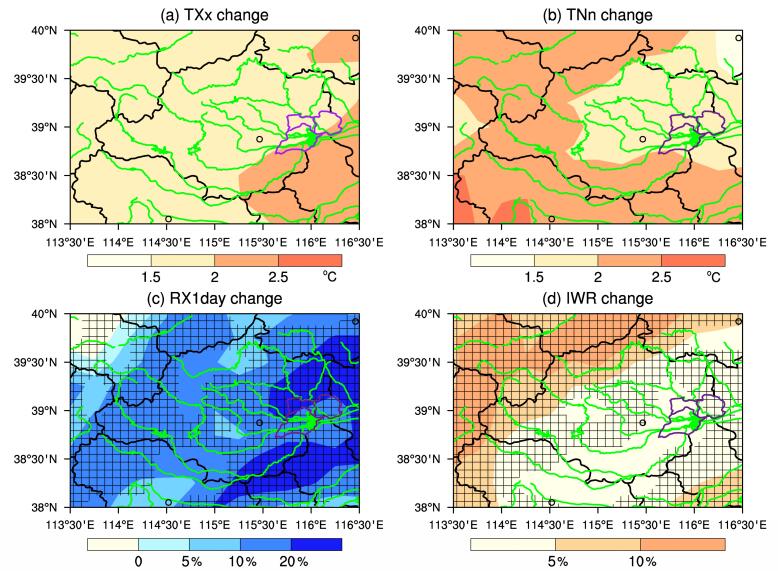
4.2 极端气温和降水指数从图 5a可知,21世纪中期分析区域内的TXx整体将上升1.5℃以上,增温的大值区(2℃~2.5℃)主要出现在东南部地区,雄安和分析区域平均的升高值分别为2.0℃(±0.5℃)和1.9℃(±0.3℃),到21世纪末,则分别达到2.8℃(±0.3℃)和2.7℃(±0.4℃)(表 3),均大于平均气温的升高。

|
图 5 多模拟集合21世纪中期极端事件和水资源指数变化的预估:(a)TXx(单位:℃);(b)TNn(单位:℃);(c)RX1day;(d)IWR。(c)和(d)中的“ +”表示4个模拟中的至少3个结果同符号 Figure 5 Ensemble means of projected changes in climate extremes and water stress index in the mid-21st century: (a) TXx (units: ℃); (b) TNn; (c) RX1day; (d) index of water stress (IWR). The "+" in (c) and (d) indicates at least 3 out of the 4 simulations agree on the sign of change |
21世纪中期的TNn(图 5b)同样将普遍增加,且幅度一般大于TXx,升温最大的西南部数值可超过2.5℃,雄安和分析区域的平均升高值分别为1.6℃(±1.2℃)和2.1℃(±1.1℃)(表 3)。21世纪末期TNn的增加值分别达到2.9℃(±1.6℃)和3.0℃(±0.7℃)(表 3)。TNn模拟结果间的离差较平均气温和TXx偏大一些。
21世纪中期的RX1day除位于西北角个别地区外,将普遍增加,增幅一般在10%~20%间,东部大部分地区达到20%以上,大于平均降水的增幅,模拟间的一致性也更好。雄安和分析区域平均的RX1day增加值在21世纪中期分别为16%(±16%)和13%(±13%),21世纪末期和平均降水增加变小一致,RX1day的增加也较小且不确定性较大,数值分别为5%(±12%)和8%(±19%)。
与未来整个中国地区的变化类似,雄安和分析区域的气温会持续升高,极端高温值增加的同时极端低温值减少,同时极端降水变化则以将普遍增加为主(Xu and Xu, 2012; 陈晓晨, 2014; Zhou et al., 2014; Ji and Kang, 2015)。
4.3 水资源指数基于观测资料的当代IWR呈现出平原地区高(最大40%以上),山区低(小于10%)的分布型[图略,可参见(石英,2010)]。具体到雄安新区,其IWR值在30%左右,即目前相对潜在蒸发,水分存在30%左右的不足。
从图 5d可以看出,21世纪中期的IWR数值将整体增加且模拟间的一致性较高,各河流起源的西北部山区和东南部平原地区为增加的大值区,数值可超过10%,其他地区在0~5%之间。虽然未来降水量有所增加(图 4b),但气温升高所引起潜在蒸发量的更大增幅,导致IWR的增加,IWR增加的大值区也对应着降水增加相对较少的地方,反映了未来分析区域的水资源不足情况将有所加重,这和石英等(2010)基于另一个区域模式模拟所得到的结果类似。雄安和分析区域IWR的增加值,在21世纪中期分别为1%(±5%)和6%(±6%),到末期水资源不足的情况将进一步加剧,将分别增加9%(±4%)和14%(±9%)。
5 结论和讨论本文基于CMIP5模式中4个全球模式(CSIRO- Mk3-6-0、EC-EARTH、HadGEM2-ES和MPI-ESM- MR)分别驱动RegCM4区域模式,所进行的RCP4.5情景下东亚区域25 km较高水平分辨率动力降尺度模拟结果,针对雄安及周边区域进行了集合分析。主要结论如下:
(1)RegCM4模式可以较好地再现当代雄安及周边区域的平均气温和降水分布,以及逐月气温和降水的年内循环特征。模式的模拟偏差在西部和北部山区较大,模拟的气温偏低、降水偏多,在平原地区的模拟则较好。
(2)模式模拟的当代极端事件指数TXx和TNn,均为在平原地区存在暖偏差、山区存在冷偏差,其中TNn在山区的冷偏差较大。模式模拟的RX1day相比于观测值整体偏大,同样在西北部山区偏大较多。
(3)多模拟集合的预估表明,未来雄安及周边区域的气温将持续上升,其中21世纪中期雄安和分析区域平均的年平均气温升幅均在1.6℃左右,21世纪末期分别达到2.2℃和2.1℃,且夏季升温更显著。未来年平均降水将有所增加,21世纪中期雄安和周边区域的增加值分别为8%和5%左右,模拟间的一致性也总体较好,冬季降水相对增加较多,但21世纪末期降水的增加幅度相对变小。
(4)与气温相关的极端指数TXx和TNn同样将明显增加,两者的上升幅度均大于平均气温,且TNn的增幅一般更大一些。21世纪中期,雄安和周边区域的TXx增加值分别为2.0℃和1.6℃,TNn的增加值分别为1.6℃和2.1℃,表明未来高温热浪事件的发生频率和强度将增加,而极端冷事件的发生频率和强度将降低。降水极端指数RX1day未来也将增加,且数值大于平均降水的增加,尤其是在东部,21世纪中期雄安及周边区域的增加值分别为16%和13%左右,但在末期的增加值有所减少,总体而言强降水事件的发生频率和强度也将增加。水资源盈亏指数IWR在未来将增大,说明水资源不足在未来将加重,21世纪中期雄安和周边区域的增加值分别在1%和6%左右,末期将达到9%和14%。
最后需要指出的是,未来尚需针对这一地区开展进一步的工作,以得到其未来气候变化更可靠的预估结果,包括通过双重嵌套方式进行的更高分辨率(5~10 km)模拟;城市化建设及白洋淀水域在当代和未来对局地气候影响的模拟;更多观测资料的搜集以更好地评估和改善模式性能,特别是在山区现有观测台站较少的地方;及将模拟结果用于驱动水文模式,得到关于水资源变化更完整的图像等,以更好地为这一地区的气候变化适应决策服务。
致谢: 石英、韩振宇、吴佳和张冬峰博士等开展和参与了相关模拟及分析工作。
陈晓晨. 2014. CMIP5全球气候模式对中国降水模拟能力的评估[D]. 中国气象科学研究院硕士学位论文, 97pp. Chen Xiaochen. 2014. Assessment of the precipitation over China simulated by CMIP5 multi-models[D]. M. S. thesis (in Chinese), Chinese Academy of Meteorological Sciences, 97pp. http://cdmd.cnki.com.cn/Article/CDMD-85101-1014215199.htm
|
Dickinson R E, Henderson-Sellers A, Kennedy P J. 1993. Biosphere-atmosphere transfer scheme (BATS) version 1e as coupled to the NCAR Community Climate Model[R]. NCAR Techical Note, NCAR/TN-387+STR, 72pp.
|
Gao Xuejie, Giorgi F. 2017. Use of the RegCM system over East Asia:Review and perspectives [J]. Engineering, 3(5): 766-772. DOI:10.1016/J.ENG.2017.05.019
|
Gao Xuejie, Wang Meili, Giorgi F. 2013. Climate change over China in the 21st century as simulated by BCC_CSM1.1-RegCM4.0 [J]. Atmospheric and Oceanic Science Letters, 6(5): 381-386. DOI:10.3878/j.issn.1674-2834.13.0029
|
Gao Xuejie, Shi Ying, Giorgi F. 2016. Comparison of convective parameterizations in RegCM4 experiments over China with CLM as the land surface model [J]. Atmospheric and Oceanic Science Letters, 9(4): 246-254. DOI:10.1080/16742834.2016.1172938
|
Gao Xuejie, Shi Ying, Song Ruiyan, et al. 2008. Reduction of future monsoon precipitation over China:Comparison between a high resolution RCM simulation and the driving GCM [J]. Meteor. Atmos. Phys., 100(1-4): 73-86. DOI:10.1007/s00703-008-0296-5
|
Gao Xuejie, Shi Ying, Zhang Dongfeng, et al. 2012. Uncertainties in monsoon precipitation projections over China:Results from two high-resolution RCM simulations [J]. Climate Res., 52: 213-226. DOI:10.3354/cr01084
|
Gao Xuejie, Shi Ying, Han Zhenyu, et al. 2017. Performance of RegCM4 over major river basins in China [J]. Advances in Atmospheric Sciences, 34(4): 441-455. DOI:10.1007/s00376-016-6179-7
|
Gao Xuejie, Wu Jie, Shi Ying, et al. 2018. Future changes of in thermal comfort conditions over China based on multi-RegCM4 simulations [J]. Atmospheric and Oceanic Science Letters. DOI:10.1080/16742834.2018.1471578
|
Giorgi F, Jones C, Asrar G R. 2009. Addressing climate information needs at the regional level:The CORDEX framework [J]. WMO Bulletin, 58(3): 175-183.
|
Giorgi F, Coppola E, Solmon F, et al. 2012. RegCM4:model description and preliminary tests over multiple CORDEX domains [J]. Climate Res., 52: 7-29. DOI:10.3354/cr01018
|
Guo Donglin, Yu Entao, Wang Huijun. 2016. Will the Tibetan Plateau warming depend on elevation in the future? [J]. J. Geophys. Res., 121(8): 3969-3978. DOI:10.1002/2016JD024871
|
韩振宇, 高学杰, 石英, 等. 2015. 中国高精度土地覆盖数据在RegCM4/CLM模式中的引入及其对区域气候模拟影响的分析[J]. 冰川冻土, 37(4): 857-866. Han Zhenyu, Gao Xuejie, Shi Ying, et al. 2015. Development of Chinese high resolution land cover data for the RegCM4/CLM and its impact on regional climate simulation (in Chinese)[J]. Journal of Glaciology and Geocryology, 37(4): 857-866. DOI:10.7522/j.issn.1000-0240.2015.0095
|
Hazeleger W, Severijns C, Semmler T, et al. 2010. EC-Earth:A seamless earth-system prediction approach in action [J]. Bull. Amer. Meteor. Soc., 91(10): 1357-1363. DOI:10.1175/2010BAMS2877.1
|
Huang Jinlong, Zhai Jiangqing, Jiang Tong, et al. 2017. Analysis of future drought characteristics in China using the regional climate model CCLM [J]. Climate Dyn.. DOI:10.1007/s00382-017-3623-z
|
IPCC. 2013. Climate Change 2013:The Physical Science Basis:Contribution of Working Group Ⅰ to the Fifth Assessment Report of the Intergovernmental Panel on Climate Change [M]. Cambridge, UK, New York, USA: Cambridge University Press: 1535pp.
|
Ji Zhenming, Kang Shichang. 2013. Projection of snow cover changes over China under RCP scenarios [J]. Climate Dyn., 41(3-4): 589-600. DOI:10.1007/s00382-012-1473-2
|
Ji Zhenming, Kang Shichang. 2015. Evaluation of extreme climate events using a regional climate model for China [J]. International Journal of Climatology, 35(6): 888-902. DOI:10.1002/joc.4024
|
Jiang Dabang, Tian Zhiping, Lang Xianmei. 2016. Reliability of climate models for China through the IPCC third to fifth assessment reports [J]. International Journal of Climatology, 36(3): 1114-1133. DOI:10.1002/joc.4406
|
Johns T C, Durman C F, Banks H T, et al. 2006. The new Hadley Centre Climate Model (HadGEM1):Evaluation of coupled simulations [J]. J. Climate, 19(7): 1327-1353. DOI:10.1175/JCLI3712.1
|
刘永强, 买买提艾力·买买提依明, 霍文, 等. 2014. 塔克拉玛干沙漠地表发射率及分布变化特征[J]. 沙漠与绿洲气象, 8(3): 1-7. Liu Yongqiang, Ail Mamitimin, Huo Wen, et al. 2014. Charactistics of land surface emissivity on distribution and variation in Taklimakan Desert (in Chinese)[J]. Desert and Oasis Meteorology, 8(3): 1-7. DOI:10.3969/j.issn.1002-0799.2014.03.001
|
Marsland S J, Haak H, Jungclaus J H, et al. 2003. The Max-Planck-Institute global ocean/sea ice model with orthogonal curvilinear coordinates [J]. Ocean Modelling, 5(2): 91-127. DOI:10.1016/S1463-5003(02)00015-X
|
Martin G M, Ringer M A, Pope V D, et al. 2006. The physical properties of the atmosphere in the new Hadley Centre Global Environmental Model (HadGEM1). Part Ⅰ:Model description and global climatology [J]. J. Climate, 19(7): 1274-1301. DOI:10.1175/JCLI3636.1
|
Oleson K W, Niu G Y, Yang Z L, et al. 2008. Improvements to the Community Land Model and their impact on the hydrological cycle [J]. J. Geophys. Res., 113(G1): G01021. DOI:10.1029/2007JG000563
|
Prabhakara C, Dalu G. 1976. Remote sensing of the surface emissivity at 9 μm over the globe [J]. J. Geophys. Res., 81(21): 3719-3724. DOI:10.1029/JC081i021p03719
|
Raddatz T J, Reick C H, Knorr W, et al. 2007. Will the tropical land biosphere dominate the climate-carbon cycle feedback during the twenty-first century? [J]. Climate Dyn., 29(6): 565-574. DOI:10.1007/s00382-007-0247-8
|
Ringer M A, Martin G M, Greeves C Z, et al. 2006. The physical properties of the atmosphere in the new Hadley Centre Global Environmental Model (HadGEM1). Part Ⅱ:Aspects of variability and regional climate [J]. J. Climate, 19(7): 1302-1326. DOI:10.1175/JCLI3713.1
|
Rotstayn L D, Collier M A, Dix M R, et al. 2010. Improved simulation of Australian climate and ENSO-related rainfall variability in a global climate model with an interactive aerosol treatment [J]. International Journal of Climatology, 30(7): 1067-1088. DOI:10.1002/joc.1952
|
石英. 2010. RegCM3对21世纪中国区域气候变化的高分辨率模拟[D]. 中国科学院大气物理研究所博士学位论文, 118pp. Shi Ying, 2010. A high resolution climate simulation of the 21st century over East Asia by RegCM3[D]. Ph. D. dissertation (in Chinese), Institute of Atmospheric Physics, Chinese Academy of Sciences, 118pp. http://kns.cnki.net/KCMS/detail/detail.aspx?filename=kxtb201205011&dbname=CJFD&dbcode=CJFQ
|
石英, 高学杰, 吴佳, 等. 2010. 华北地区未来气候变化的高分辨率数值模拟[J]. 应用气象学报, 21(5): 580-589. Shi Ying, Gao Xuejie, Wu Jia, et al. 2010. Simulating future climate changes over North China with a high resolution regional climate model (in Chinese)[J]. J. Appl. Meteor. Sci., 21(5): 580-589. DOI:10.3969/j.issn.1001-7313.2010.05.007
|
Taylor K E, Stouffer R J, Meehl G A. 2012. An overview of CMIP5 and the experiment design [J]. Bull. Amer. Meteor. Soc., 93(4): 485-498. DOI:10.1175/BAMS-D-11-00094.1
|
Thornthwaite C W. 1948. An approach toward a rational classification of climate [J]. Geographical Review, 38(1): 55-94. DOI:10.2307/210739
|
UNEP. 1992. World Atlas of Desertification [M]. London, UK: Edward Arnold: 69pp.
|
Van Vuuren D P, Edmonds J, Kainuma M, et al. 2011. The representative concentration pathways:An overview [J]. Climatic Change, 109(1-2): 5-31. DOI:10.1007/s10584-011-0148-z
|
吴佳, 高学杰. 2013. 一套格点化的中国区域逐日观测资料及与其它资料的对比[J]. 地球物理学报, 56(4): 1102-1111. Wu Jia, Gao Xuejie. 2013. A gridded daily observation dataset over China region and comparison with the other datasets (in Chinese)[J]. Chinese Journal of Geophysics, 56(4): 1102-1111. DOI:10.6038/cjg20130406
|
Xu Chonghai, Xu Ying. 2012. The projection of temperature and precipitation over China under RCP scenarios using a CMIP5 multi-model ensemble [J]. Atmospheric and Oceanic Science Letters, 5(6): 527-533. DOI:10.1080/16742834.2012.11447042
|
Zhang Xuebin, Alexander L, Hegerl G C, et al. 2011. Indices for monitoring changes in extremes based on daily temperature and precipitation data [J]. WIREs:Climate Change, 2(6): 851-870. DOI:10.1002/wcc.147
|
Zhang Yujing, Fu Liang, Pan Jie, et al. 2017. Projected changes in temperature extremes in China using PRECIS [J]. Atmosphere, 8(1): 15. DOI:10.3390/atmos8010015
|
Zhou Botao, Wen Q H, Xu Ying, et al. 2014. Projected changes in temperature and precipitation extremes in China by the CMIP5 multimodel ensembles [J]. J. Climate, 27(17): 6591-6611. DOI:10.1175/JCLI-D-13-00761.1
|
Zou Liwei, Zhou Tianjun. 2013. Near future (2016-40) summer precipitation changes over China as projected by a regional climate model (RCM) under the RCP8.5 emissions scenario:Comparison between RCM downscaling and the driving GCM [J]. Advances in Atmospheric Sciences, 30(3): 806-818. DOI:10.1007/s00376-013-2209-x
|
 2018, Vol. 42


