2 广东省气象台, 广州 510640
3 北京市气象局, 北京 100089
2 Guangdong Meteorological Observatory, Guangzhou 510640
3 Beijing Meteorological Bureau, Beijing 100089
我国最强降水均由台风引起,迄今为止排名前五的台风24 h降水记录均在台湾岛观测到。台风“贺伯”(Herb,9608)、“解拉”(Carla,6718)和“莫拉克”(Morakot,0908)位列前三强,24 h降水量分别为1748.5mm、1672.6mm和1623.5mm(Chen et al., 2010)。其中台风Morakot导致台湾岛遭受近50年来最惨重的“八八水灾”,引起了热带气旋研究的极大关注。
研究表明,Morakot在台湾岛产生的极端降水事件主要由西南季风系统带来的充足水汽所导致(Ge et al., 2010; Hong et al., 2010; Van Nguyen and Chen, 2011)。台湾地形的强迫效应在一定程度上也增加了降水强度,使降水分布不均匀(陈台琦等,2010;Kuo et al., 2010)。同时Morakot较大尺度及较强环流的结构特征也有一定影响(周仲岛等, 2010)。不少研究强调,Morakot极端降水与其在台湾岛附近异常缓慢运动有着紧密联系(Hong et al., 2010; Chien and Kuo, 2011; Wu et al., 2011)。张建海等(2011)、徐丽丽等(2010)分析大尺度环境变化对Morakot路径的影响,指出西太平洋副热带高压(以下简称副高)减弱东退,导致引导气流强度和方向改变,加上另外两个台风“艾涛”(Etau,0909)、“天鹅”(Goni,0907)与Morakot相互牵制,是造成Morakot移速减慢的主要原因。而Wu et al.(2011)认为低频季风涡旋与台风涡旋的相互作用使Morakot登陆后西行,并在台湾地区长期滞留。Liang et al.(2011)通过数值试验进一步证明了低频涡旋使其移动缓慢。研究还发现台湾岛复杂地形也是影响Morakot运动的一个重要原因。Wang et al.(2012)的数值试验表明在台湾地形影响下岛上台风降水呈非对称分布,在Morakot中心附近产生非对称加热,减慢了台风移速。张建海等(2011)的数值试验显示诱生低压的发生发展导致Morakot以西折路径过岛。鲍旭炜等(2013)利用再分析资料揭示了Morakot过岛过程中诱生低压替代原台风中心的过程。这些研究表明,Morakot在台湾岛附近的缓慢运动与大尺度环流、台湾地形等因子的复杂影响有关。但关于地形影响台风结构从而影响台风移速变化的过程尚未完全清楚。本文将利用NCEP-GFS实时分析场资料(0.5°×0.5°),台湾省台风资料库地面观测资料(http://photino.cwb.gov.tw/tyweb/tyfnweb/htm/p-2009morakot.htm [2016-07-09])以及WRF模式10 km水平分辨率的模拟资料,进一步讨论过岛台风结构变化对其运动的影响。
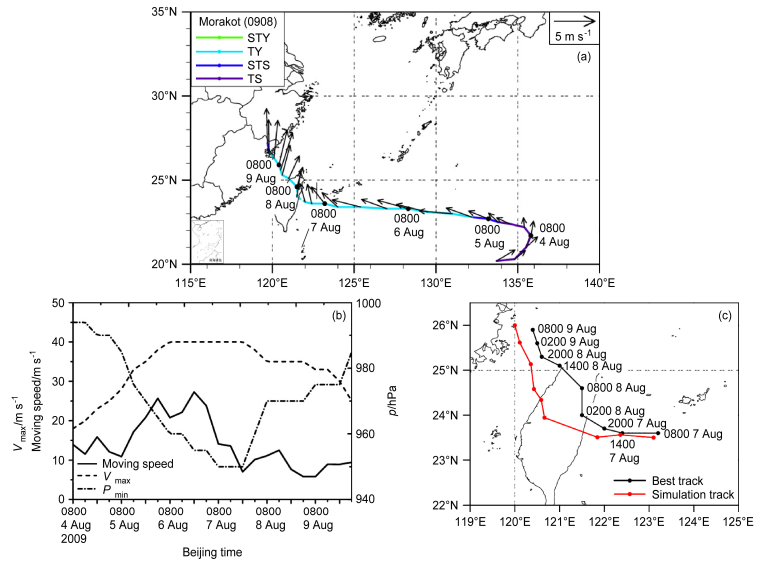
2 Morakot缓慢过岛的环流背景 2.1 过岛运动特征及其模拟台风Morakot于2009年8月3日生成于西北太平洋,随后稳定西行,强度逐渐加强,5日达到台风级别。7日23:45(北京时,下同)在台湾岛花莲首次登陆,从中部偏北区域过岛,进入台湾海峡后向北偏折,9日17:30在福建霞浦再次登陆(图 1a),最后减弱消失在日本东北部海面。整个过程中Morakot移速变化复杂,8月4日08:00至8月7日08:00稳定西行,平均约18.1 km h−1,强度逐渐增强,7日08:00到8日14:00,在台湾岛附近缓慢运动,平均约10 km h−1,强度减弱。8日14:00离开台湾岛进入台湾海峡后北折,到二次登陆过程中,移速仍然较慢,平均约7.7 km h−1(图 1b)。
|
图 1 (a)中国气象局(China Meteorological Administration,简称CMA)台风Morakot(0908)最佳路径[带点实线,颜色表示各个强度等级:强台风(STY)、台风(TY)、强热带风暴(STS)、热带风暴(TS)]和引导气流矢量(箭头,单位:m s−1);(b)Morakot移速(实线,单位:km h−1)、最大持续风速(Vmax,虚线,单位:m s−1)、海平面气压(点划线,单位:hPa)的时间变化;(c)模式模拟路径(红色带点实线)与CMA最佳路径(黑色带点实线)对比。图中所有时间均为北京时间 Figure 1 (a) The track of typhoon Morakot (2009) from CMA (China Meteorological Administration) best track database [solid line with dots, different colors indicate the variation of intensity, intensity: Severe Typhoon (STY), Typhoon (TY), Severe Tropical Storm (STS), and Tropical Storm (TS)] and vectors of the steering flow (units: m s−1). (b) Time series of Morakot moving speed (solid line, units: km h−1), maximum sustained wind speed (dashed line, units: m s−1), and minimum sea level pressure (dotted line, unis: hPa). (c) Comparison of typhoon tracks from simulation (red solid line with dots) and the CMA best track data (black solid line with dots) during 7–9 August 2009. All times in Fig. 1 are Beijing times |
为了细致地了解Morakot的过岛过程,本文利用美国国家大气研究中心(NCAR)和美国国家海洋和大气管理局(NOAA)共同开发的中尺度数值模式ARW-WRF(2.2版本)的数值模拟结果进行分析。模式采用双重嵌套,水平分辨率分别为30 km和10 km,垂直分辨率为28层,模式顶为50 hPa,积分步长180 s;模拟时段为8月7日08:00至9日08:00,每一小时输出一次结果;物理参数方案分别为RRTM长波辐射方案、Dudhia短波辐射方案、Lin微物理方案和Kain-Fritsch积云参数化方案等[详细模拟介绍见徐洪雄(2013)]。从图 1c最佳路径与模拟路径图可知,前12小时模拟路径基本与最佳路径相吻合,过岛时路径偏南约30 km。模拟过程Morakot平均移速比最佳路径略快约1 km h−1。总体上模拟出Morakot缓慢经过台湾岛的过程。
2.2 环流形势及引导气流大尺度环流主导着台风运动(陈联寿和丁一汇,1979),是决定台风引导气流大小和方向的重要因子。统计研究表明引导气流迅速调整和突变会导致台风移动突变(Chan and Gray, 1982)。此处取距离台风中心周围1°~6°半径圆环范围,计算1000~200 hPa平均引导气流(图 1a矢量箭头所示)。
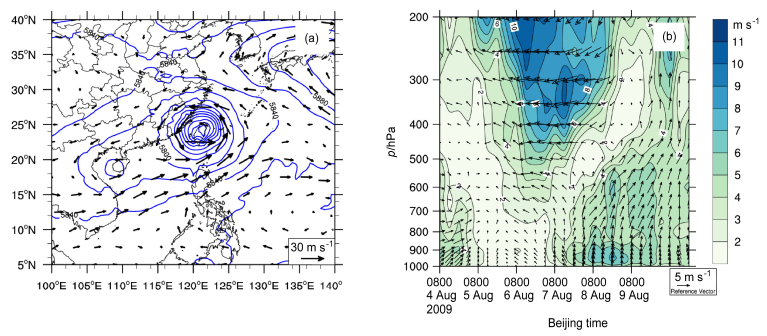
从环流形势上看,8月4日至8月6日Morakot主要在副高南侧较强的偏东气流引导下稳定西行,引导气流方向与Morakot移动方向偏差较小(图 1a)。此时台风Goni以及我国大陆山西—湖北上空的西风槽与Morakot相距较远,相互作用较小(图略)。7日14:00,Morakot移到台湾岛附近,副高明显减弱东退约10个经距,引导气流减弱,Morakot移速减慢(图 1b实线)。台风Goni在海南岛附近稳定少动,在Morakot登陆台湾岛前后,二者相距均在15个经纬距以内(图 2a),引导气流同台风实际移向偏差明显增大(图 1a)。这与两台风产生的双台风效应(Fujiwhara, 1921;Brand, 1970)有关,二者逆时针互旋使Morakot叠加了向西和向南移动趋势。此时Morakot东侧洋面上还存在另一台风Etau,不过二者相距比较远,影响较小。8日14::00 Morakot进入台湾海峡,与Goni距离增加至15个经纬距以上,二次登陆福建霞浦后北上,经福建、浙江、江苏省,最后向东北方向移去。
|
图 2 (a)2009年8月8日08:00 500 hPa高度场(等值线,单位:gpm)和风矢量场(箭头,单位:m s−1);(b)各气压层引导气流方向(箭头)及大小(阴影,单位:m s−1)随时间的变化 Figure 2 (a)Distributions of 500-hPa geopotential height (contours, units: gpm) and wind vectors (units: m s−1) at 0800 BJT (Beijing time) 8 August 2009. (b) Time–pressuredistributions of steering flow vectors (units: m s−1) and speeds (shaded, units: m s−1) from 1000 hPa to 200 hPa |
图 2b为不同高度上引导气流的时间演变。7日08:00之前,在整层较为一致的偏东引导气流牵引下,Morakot稳定西行。此后,在其过岛过程中,低层逐渐转为西南气流,风速增强,高层则逐渐转为偏北气流,风速减弱,高低层引导气流方向相反,对Morakot运动引导方向不一致,整层环境引导气流减弱。8日14:00 Morakot进入台湾海峡,高层转为偏南引导气流,整层引导气流方向趋于一致,风速加强,Morakot北折。
可见Morakot过台湾岛过程中环境引导气流较弱,移速减慢,但引导气流方向与Morakot实际运动偏差较大。说明除了大尺度环流变化影响以及双台风效应外,还有其它因素影响Morakot运动。
3 过岛台风结构变化与缓慢运动台湾岛地形会改变台风结构,导致其路径异常。如地形诱生低压会使台风过岛路径不连续,即山脉背风坡诱生低压替代原台风中心的过程(Lin et al., 2005;Peng et al., 2012)。地形作用可使过岛台风环流出现沿山流、阻挡流、爬山流三种环流类型(谢信良等,1998)。王时鼎(1980)统计发现,连续路径过岛台风环流改变较小,而不连续路径的台风环流会明显改变。另外台湾海峡的狭管效应会造成台风的结构非对称,影响其运动(Yeh and Elsberry, 1993a; Jian and Wu, 2008; Huang et al., 2011)。这里利用台湾省台风资料库地面气压场分析图及模式10 km模拟结果,分析Morakot在过岛过程中的结构变化。
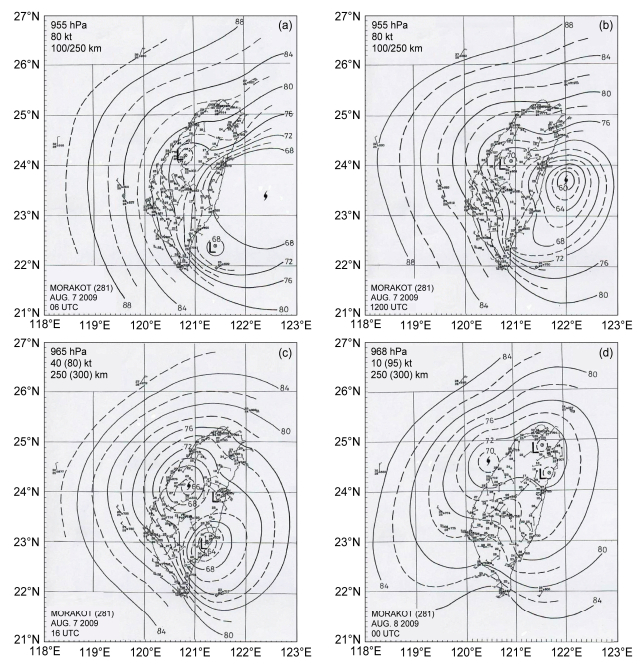
3.1 结构变化特征地面气压观测分析(图 3)显示,Morakot在过台湾岛过程中,岛屿不同方位有不同强度诱生低压生成。登陆台湾岛之前7日14:00(图 3a),台湾岛东南侧、西北侧均可见诱生低压(符号L所示位置),随着Morakot靠近台湾岛,后者逐渐发展(图 3b),并于8日00:00(图 3c)替代原台风中心形成不连续路径,东侧原台风中心维持约6 h后消失。8日08:00台湾岛东北部出现另一诱生低压(图 3d),并随台风北移维持约12 h后消失。可见台风环流内,台湾岛西、东两侧诱生低压,一个替代了台风中心,另一个使台风气压场分布不均匀,造成台风环流结构松散分裂。
|
图 3 2009年8月(a)7日14:00、(b)7日20:00、(c)8日00:00和(d)8日08:00台风Morakot过岛过程中地面气压场(等值线,单位:hPa,图中两位数数值表示气压值,如数值“68”代表的气压为968 hPa,横坐标为东经,纵坐标为北纬),L表示诱生低压中心,台风符号即为当前台风位置。引自http://photino.cwb.gov.tw/tyweb/tyfnweb/htm/p-2009morakot.htm [2016-07-09] Figure 3 Observations of sea level pressure (contours, hPa) at (a) 1400 BJT and (b) 2000 BJT 7 Aug, (c) 0000 BJT and (d) 0800 BJT 8 Aug. Typhoon symbol and character "68" indicate the pressure is 968 hPa, horizontal coordinates is Northern Latitude, "vertical ordinate is east longitude. L" indicate the locations of the typhoon and terrain-induced low pressure center, respectively. Quote from http://photino.cwb.gov.tw/tyweb/tyfnweb/htm/p-2009morakot.htm [2016-07-09] |
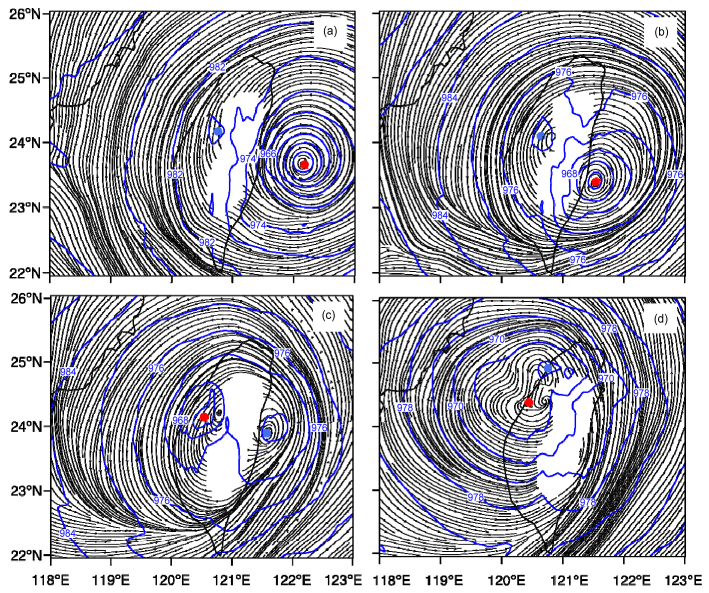
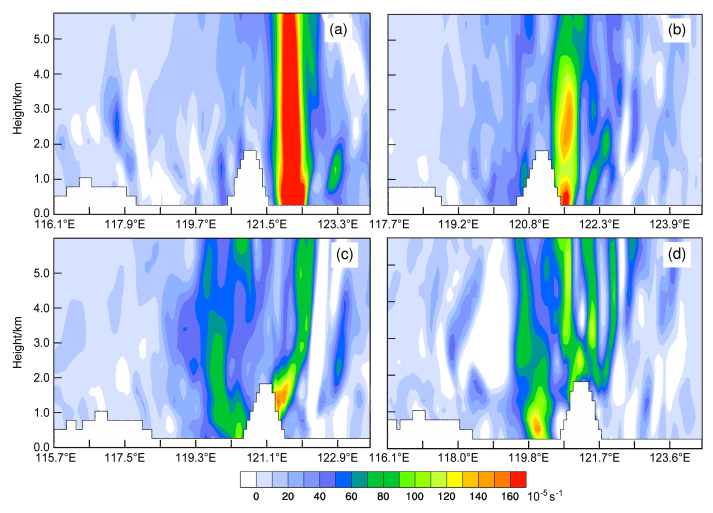
为进一步了解诱生低压导致台风结构变化对其路径变化的影响,下文利用模式模拟结果作进一步分析。图 4给出模拟台风过岛过程中海平面气压场及850 hPa流场,图 5为其相应时间垂直涡度沿诱生低压和台风中心连线的垂直剖面。
|
图 4 2009年8月(a)7日14:00、(b)7日20:00、(c)8日00:00和(d)8日08:00模拟台风海平面气压场(蓝色等值线,间隔4 hPa)与850 hPa流场(黑色流线)。红点、蓝点分别为台风位置和诱生低压位置 Figure 4 Distributions of sea level pressure (contours, 4 hPa intervals) and 850 hPa streamlines at (a) 1400 BJT 7 Aug, (b) 2000 BJT 7 Aug, (c) 0000 BJT 8 Aug, and (d) 0800 BJT 8 Aug, 2009. The red and blue dots indicate the locations of the typhoon and terrain-induced low pressure center, respectively |
|
图 5 2009年8月(a)7日14:00、(b)7日20:00、(c)8日00:00和(d)8日08:00沿台风中心及诱生低压中心剖面上绝对涡度(单位:10−5 s−1)分布 Figure 5 Vertical distributions of absolute vorticity along typhoon and the induced low center (shaded, units: 10−5 s−1) at (a) 1400 BJT 7 Aug, (b) 2000 BJT 7 Aug, (c) 0000 BJT 8 Aug, and (d) 0800 BJT 8 Aug, 2009 |
7日14:00(图 4a),模拟台风位于台湾岛东部海域(红点),台湾岛西北侧诱生低压(蓝点所示)强度较弱,海平面气压场上仅见一闭合等压线,850 hPa流场上还未出现明显的闭合风场。此时台风较强,对应中心上空正涡度柱垂直向上(图 5a)。7日20:00,诱生低压发展,中心气压下降(图 4b),低层风场气旋性扰动及其上空正涡度加强(图 5b)。8日00:00(图 4c),海平面气压场上台湾岛西北侧诱生低压环流中心强度已强于东侧,850 hPa流场形成闭合气旋环流,已取代台风中心,而原台风环流中心仍滞留于岛屿东侧。相应涡度剖面显示(图 5c),西侧涡度增强,垂直向上伸展,诱生低压发展成熟;东侧环流中心受到破坏,10 km以下低层正涡度消失,但高层仍残留有一定强度的正涡度柱,此时正涡度柱仍未过山,随高度向东倾斜。
此后,台风在台湾岛西侧缓慢运动,8日08:00(图 4d),台风中心北侧出现另一弱的诱生低压。在海平面气压场上可见较小的闭合环流,850 hPa上仅见弱的扰动使台风风场结构松散。此时垂直涡柱已逐渐移至山脉西侧,在诱生低压上空垂直向上伸展(图 5d),台风中心替代过程结束。之后台风结构恢复紧凑(图略),完全进入台湾海峡后,向北偏西方向移动。
以上分析可见,观测资料和模拟资料均较好反映了Morakot过岛期间诱生低压的活动及其不连续过岛路径。模拟台风从其登陆台湾岛前移速减慢,到山脉西侧诱生低压发展并最终替代岛东侧的台风中心,历时约18小时。经历了低层环流从分裂到重组,台风正垂直涡度柱从垂直到倾斜再到垂直的复杂变化过程。这段时间内环境引导气流约9.7 km h−1,如果没有诱生低压的替代过程,18小时台风大约可移动175 km,大于台湾岛东西宽度(约100~140 km),则过岛时间将会缩短。陈联寿和罗哲贤(1995)研究表明,台风环流内中尺度涡旋会使台风结构变得非对称,导致其在移动路径上蛇形摆动,减缓移速,并通过改变台风外区的水平风速,从而改变台风环境引导气流的强度,使台风路径与引导气流产生偏差。Yang et al.(2008)的地形敏感性试验也发现,台湾岛山脉越高,山脉另一侧产生诱生低压越强,台风在山脉东侧打转并随后被诱生低压替代,形成不连续路径缓慢过岛。当地形完全去除之后,诱生低压及打转路径均消失,台风迅速过岛。因此可以认为Morakot过岛前后出现的不连续路径,增加了其在台湾岛附近的逗留时间。
3.2 中尺度扰动涡旋的影响利用Barnes滤波方法(Barnes,1973;陈忠明,1992;安成等,2013),基于模式资料,分离出台风环流中地形诱生的中尺度扰动涡旋,以进一步探讨其对台风运动的影响。该方法选择两组不同的滤波参数得到对应低通滤波场,二者相减获得的结果过滤了短波噪声和大气低频变化,主要保留中尺度波段信息。其响应函数如下:
| $ R = {R_0}(1 + R_0^{g - 1} - R_0^g), $ | (1) |
| $ {R_0} = \exp ( - \frac{{4{\pi ^2}c}}{{{\lambda ^2}}}), $ | (2) |
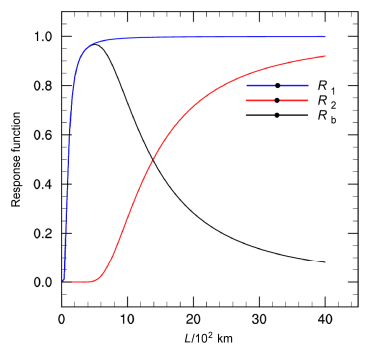
其中,c和g为滤波参数,λ为所要最大被保留的波长。考虑台风中尺度扰动涡旋的大小,本文取λ为300 km,c=600 km2,g=0.3,带入公式(1)和(2)得到其一低通滤波器响应函数R1;取c=110000 km2,g=0.3得到另一低通滤波器响应函数R2。两者相减,Rb=R1-R2即为带通滤波响应函数。从图 6可以看出,带通滤波的最大响应波长位于500 km左右,即波长为500 km左右的波动几乎被完全保留,波长为200~600 km的波动保留了90%以上。由此获得以波长200~600 km为主的中尺度扰动场。
|
图 6 Barnes滤波响应函数随波长(L,单位:km)的变化,R1、R2为λ取300 km,g取0.3,c分别取600 km2和110000 km2时的低通滤波场响应函数,Rb=R1-R2为带通滤波场响应函数 Figure 6 Response functions of the Barnes low-pass filter (R1 and R2 when λ=300 km, g=0.3, c= 600 km2 and 110000 km2, respectively) and the Barnes band-pass filter (Rb=R1-R2) varying with wavelength (L, km) |
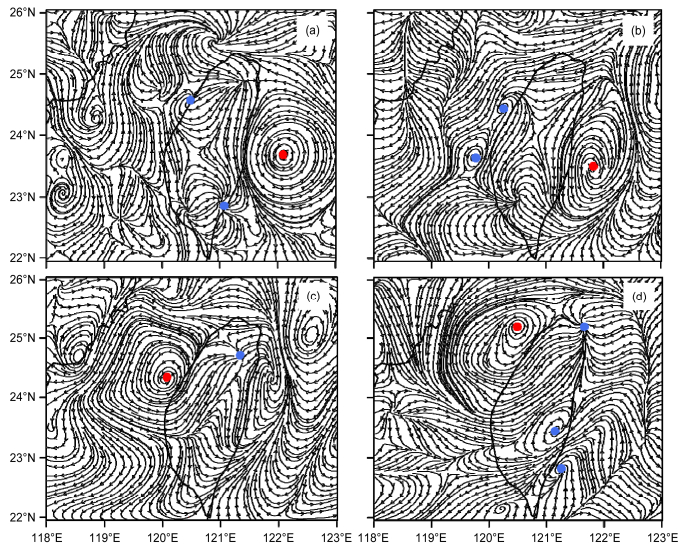
低层中尺度扰动场可清楚显示上述诱生低压所对应的扰动涡旋活动(图 7)。7日14:00(图 7a),台湾岛东南侧可见中尺度扰动涡旋(蓝点),7日18:00后消失(图略)。此间台风扰动涡旋(红点)西行且向南摆动,诱生低压消失之后又向北摆动。7日20:00台湾岛西北侧中尺度扰动场辐合明显,7日22时形成闭合流场(图略),8日00:00台湾岛西侧可见明显的扰动涡旋(图 7b),随后扰动涡旋继续发展,而台风扰动涡旋减弱,至8日04:00(7c),西侧扰动涡旋发展成熟,完全取代台风中心。8日18:00西侧扰动涡旋北移,而台湾岛东侧仍有低压扰动产生(图 7d),不久消失。可见Morakot在台湾岛附近的中尺度扰动涡旋活动反映了地形诱生低压活动。
|
图 7 2009年8月(a)7日14:00、(b)8日00:00、(c)8日04:00和(d)8日18:00 700 hPa中尺度扰动流场,红点、蓝点分别表示台风扰动涡旋及气旋性中尺度涡旋位置 Figure 7 Streamline fields of mesoscale disturbance on 700hPa at (a) 1400 BJT 7 Aug, (b) 0000 BJT 8 Aug, (c) 0400 BJT 8 Aug, and (d) 1800 BJT 8 Aug, 2009. The red and blue dots indicate the locations of the typhoon vortex and mesoscale vortices, respectively |
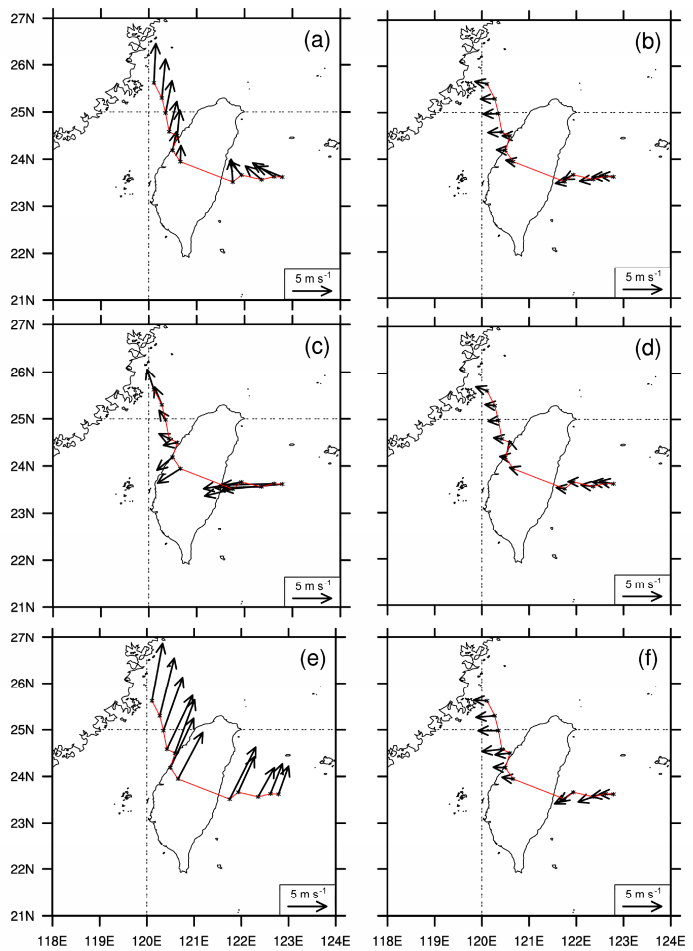
为考察中尺度扰动在台风环境引导气流中所起作用,基于模拟资料,计算台风滤波前环境引导气流及其中尺度扰动造成引导气流(图 8)。图 8a显示滤波前模拟台风过岛过程中环境整层平均引导气流变化(925~250 hPa),可以看出结果与实时分析场资料相似,即过岛过程中环境引导气流方向与台风实际运动方向存在较大偏差。登陆台湾岛之前,引导气流由东南气流转为偏南气流,过岛时引导气流减弱,过山后又逐渐增强。虽然在较强的偏南气流引导下出现明显北折,但多个时次与台风的实际运动有明显偏差。从高层与低层平均引导气流来看,高层为偏东引导气流(图 8c),低层为偏南引导气流(图 8e)。这与低层西南季风卷入台风有关,说明台风环境引导气流与其实际路径的偏差主要是由于低层环流的作用所导致。
|
图 8 2009年8月7~9日模拟台风每两小时移动路径(红线)及滤波前(左列)和中尺度扰动(右列)环流计算的台风引导气流矢量(单位:m s−1):(a、b)925~250 hPa整层平均;(c、d)500~250 hPa中高层平均;(e、f)925~700 hPa低层平均 Figure 8 Simulated tracks (red line at 2-h intervals) with steering flow vectors (units: m s−1) during 7–9 August 2009 calculated by original typhoon fields (left column) and mesoscale disturbance fields through the Barnes band-pass filter (right column) averaged over (a, b) 925–250 hPa, (c, d) 500–250 hPa, and (e, f) 925–700 hPa |
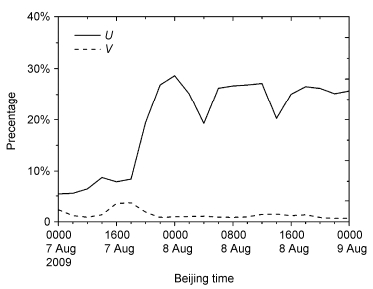
图 8b、d、f为中尺度扰动场计算的引导气流。可以看出,不管是整层、低层和高层平均,均为偏东气流引导,较好指示了台风西行趋势。虽然扰动引导气流比台风环境引导气流小一个量级,但在过岛过程中明显增加。计算整层扰动引导气流纬向(U)和经向(V)占滤波前环境引导气流u、v分量百分比的时间演变(图 9),发现整个过程扰动引导气流V分量所占百分比没有明显变化,仅约1%。而扰动引导气流U分量7日18:00之前也仅占到环境引导气流u分量的7%左右。7日20:00之后台风过岛期间却增加至约26%,较好揭示了台风向西运动,也说明台风结构变化是台风西行过岛的重要原因之一。
|
图 9 纬向(U,实线)、经向(V,虚线)扰动引导气流占环境引导气流u、v分量的百分比时间演变 Figure 9 Time series of percentages of zonal (U, solid line) and meridional (V, dashed line) components of the mesoscale disturbance in the environmental steering flow (u, v) |
综上所述,Morakot在偏南的环境引导气流中的过岛西行与其结构变化密切相关。包含地形诱生低压的中尺度扰动场产生的向西引导气流虽然是个小量,但其突然增强可作为台风过岛西行的一个指标。
4 结论0908号台风Morakot在台湾岛附近缓慢运动引起了24 h超过1000 mm的强烈降水。本文利用NCEP-GFS实时分析资料(0.5°×0.5°)、台湾省台风资料库地面气压场资料和中尺度数值模式WRF模拟结果,研究了台风Morakot过台湾岛的结构变化特征以及地形诱生低压对其路径的影响,结果表明:
(1)Morakot缓慢过岛西行是较弱环境引导气流、双台风作用以及地形诱生低压共同影响的结果。
(2)Morakot在台湾岛的缓慢运动与环境大气环流系统活动有关。一方面副高减弱东退导致台风引导气流减弱,使其在靠近台湾岛时减速。另一方面与台风Goni的双台风效应也使Morakot产生偏西偏南运动趋势,移速减慢。
(3)Morakot过岛期间偏南的环境引导气流与台风实际的西行运动存在明显偏差,而这种偏差与台风环流内台湾地形诱生低压的活动有关。诱生低压活动导致Morakot环流的非对称结构,造成其低层环流分裂、重组、台风正垂直涡度柱从垂直到倾斜再到垂直的复杂变化过程,使Morakot出现不连续路径,增加了在台湾岛附近的活动时间。可以认为地形产生的台风非对称结构在一定程度上对其运动起着重要作用。
(4)中尺度扰动场揭示了台风环流内诱生低压活动情况。其产生的偏东引导气流虽然比环境引导气流小一个量级,但在过岛过程中的明显增强较好揭示了台风的西行趋势。
本文研究表明台湾地形Morakot结构的影响是其路径变化的一个重要原因。但地形影响是比较复杂的,与环流背景、台风强度及其登陆位置等都有关系。不连续路径的产生是各因子协调作用的结果。过岛台风结构变化及其影响路径的机理还需更多个例和更深入研究。
安成, 袁金南, 蒙伟光, 等. 2013. 登陆的0915号热带气旋"巨爵"降水分布及其中尺度结构的分析[J]. 热带气象学报, 29(5): 727-736. An Cheng, Yuan Jinnan, Meng Weiguang, et al. 2013. An analysis of distribution and mesoscale structure of precipitation about landfalling tropical cyclone No.0915-"Koppu"[J]. Journal of Tropical Meteorology (in Chinese), 29(5): 727-736. DOI:10.3969/j.issn.1004-4965.2013.05.003
|
鲍旭炜, 雷小途, 唐碧, 等. 2013. 热带气旋过台湾岛引起的副中心特征分析[J]. 热带气象学报, 29(5): 717-726. Bao Xuwei, Lei Xiaotu, Tang Bi, et al. 2013. An analysis on the features of secondary center produced by the tropical cyclones crossing Taiwan[J]. Journal of Tropical Meteorology (in Chinese), 29(5): 717-726. DOI:10.3969/j.issn.1004-4965.2013.05.002
|
Barnes S L. 1973. Mesoscale objective map analysis using weighted time-series observations[R]. NOAA Tech. Memo. ERL NSSL-62.
|
Brand S. 1970. Interaction of binary tropical cyclones of the western North Pacific Ocean[J]. J. Appl. Meteor., 9(3): 433-441. DOI:10.1175/1520-0450(1970)009<0433:IOBTCO>2.0.CO;2
|
Chan J C L, Gray W M. 1982. Tropical cyclone movement and surrounding flow relationships[J]. Mon. Wea. Rev., 110(10): 1354-1374. DOI:10.1175/1520-0493(1982)110<1354:TCMASF>2.0.CO;2
|
Chen L S, Li Y, Chen Z Q. 2010. An overview of research and forecasting on rainfall associated with landfalling tropical cyclones[J]. Advances in Atmospheric Sciences, 27(5): 967-976. DOI:10.1007/s00376-010-8171-y
|
陈联寿, 丁一汇. 1979. 西太平洋台风概论[M]. 北京: 科学出版社. Chen Lianshou, Ding Yihui. 1979. Overview of the Typhoon in Northwest Pacific[M] (in Chinese). Beijing: Science Press.
|
陈联寿, 罗哲贤. 1995. 不同尺度涡旋相互作用对台风的结构和移动的影响[J]. 热带气象学报, 11(1): 10-17. Chen Lianshou, Luo Zhexian. 1995. The effects of interactions between different vortices on the structure and movement of tropical cyclone[J]. Journal of Tropical Meteorology (in Chinese), 11(1): 10-17. DOI:10.16032/j.issn.1004-4965.1995.01.002
|
陈台琦, 魏志宪, 林沛练, 等. 2010.莫拉克台风雷达观测中尺度雨带特征[R]//莫拉克台风科学小组, 许晃雄.国科会莫拉克颱风科学报告, 53-81. Chen Taiqi, Wei Zhixian, Lin Peilian, et al. 2010. The characteristics of radarobserved mesoscale rainbands of typhoon Morakot (2009) (in Chinese)[R]//Hsu H H. Taipei, Taiwan, National Science Council. Scientific Report on Typhoon Morakot (2009), 53-81.
|
陈忠明. 1992. 气象场中尺度带通滤波方法研究[J]. 气象学报, 50(4): 504-510. Chen Zhongming. 1992. Study of mesoscale band-pass filtering method for meteorological fields[J]. Acta Meteorologica Sinica, 50(4): 540-510. DOI:10.11676/qxxb1992.062
|
Chien F C, Kuo H C. 2011. On the extreme rainfall of typhoon Morakot (2009)[J]. J. Geophys. Res., 116(D5): D05104. DOI:10.1029/2010JD015092
|
Fujiwhara S. 1921. The natural tendency towards symmetry of motion and its application as a principle in meteorology[J]. Quart. J. Roy. Meteor. Soc., 47(200): 287-292. DOI:10.1002/qj.49704720010
|
Ge Xuyang, Li T, Zhang Shengjun, et al. 2010. What causes the extremely heavy rainfall in Taiwan during typhoon Morakot (2009)?[J]. Atmospheric Science Letters, 11(1): 46-50. DOI:10.1002/asl.255
|
Hong C C, Lee Mingying, Hsu H H, et al. 2010. Role of submonthly disturbance and 40-50 day ISO on the extreme rainfall event associated with typhoon Morakot (2009) in Southern Taiwan[J]. Geophys. Res. Lett., 37(8): L08805. DOI:10.1029/2010GL042761
|
Huang Y H, Wu C C, Wang Yuqing. 2011. The influence of island topography on typhoon track deflection[J]. Mon. Wea. Rev., 139(6): 1708-1727. DOI:10.1175/2011MWR3560.1
|
Jian Guoji, Wu C C. 2008. A numerical study of the track deflection of supertyphoon Haitang (2005) prior to its landfall in Taiwan[J]. Mon. Wea. Rev., 136(2): 598-615. DOI:10.1175/2007MWR2134.1
|
Kuo H C, Yang Y T, Chang C P. 2010. Typhoon Morakot (2009): Interplay of southwest monsoon, terrain, and mesoscale convection[C]//Int. Workshop on Typhoon Morakot (2009). Taipei, Taiwan: National Science Council and National Applied Research Laboratories, 55-73.
|
Liang Jia, Wu Liguang, Ge Xuyang, et al. 2011. Monsoonal influence on typhoon Morakot (2009). Part Ⅱ:Numerical study[J]. J. Atmos. Sci., 68(10): 2222-2235. DOI:10.1175/2011JAS3731.1
|
Lin Y L, Chen Shuyun, Hill C M, Huang C Y. 2005. Control parameters for the influence of a mesoscale mountain range on cyclone track continuity and deflection[J]. Journal of the Atmospheric Sciences, 62(6): 1849-1866. DOI:10.1175/JAS3439.1
|
Peng L, Wang S T, Shieh S L, et al. 2012. Surface track discontinuity of tropical cyclones crossing Taiwan:A statistical study[J]. Mon. Wea. Rev., 140(1): 121-139. DOI:10.1175/MWR-D-10-05050.1
|
Van Nguyen H, Chen Yileng. 2011. High-resolution initialization and simulations of typhoon Morakot (2009)[J]. Mon. Wea. Rev., 139(5): 1463-1491. DOI:10.1175/2011MWR3505.1
|
Wang C C, Kuo H C, Chen Yihan, et al. 2012. Effects of asymmetric latent heating on typhoon movement crossing Taiwan:The case of Morakot (2009) with extreme rainfall[J]. J. Atmos. Sci., 69(11): 3172-3196. DOI:10.1175/JAS-D-11-0346.1
|
王时鼎. 1980.台湾近海台风运动及其强度预报法[R].国科会研究报告018号-100. Wang Shiding. Prediction of the movement and strength of typhoons in Taiwan and its vicinity (in Chinese)[R]. National Science Council Research Rep. 018, 100 pp.
|
Wu Liguang, Liang Jia, Wu C C. 2011. Monsoonal influence on typhoon Morakot (2009). Part Ⅰ:Observational analysis[J]. J. Atmos. Sci., 68(10): 2208-2221. DOI:10.1175/2011JAS3730.1
|
谢信良, 王时鼎, 郑明典, 等. 1998.百年侵台台风路径图集及其应用——台湾地区台风预报辅助系统建立之研究(三)[R].中央气象局专题研究报告 CWB86-1M-01, 497pp. Xie Xinliang, Wang Shiding, Zheng Mingdian, et al. 1998. Tropical cyclone tracks over Taiwan from 1897 to 1996 and their applications (in Chinese)[R]. Research Report CWB86-1M-01, Atmospheric R. And D. Center, Central Weather Bureau, Taiwan, Rep. of China, 497pp.
|
徐洪雄. 2013.互旋过程双台风相互作用及其环境主体水汽流影响[D].南京信息工程大学博士学位论文, 91 pp. Xu Hongxiong. 2013. Binary tropical cyclone during their mutual rotation and its response to environmental moisture transport[D]. Ph. D. dissertation (in Chinese), Nanjing University of Information Science and Technology, 91pp. http://cdmd.cnki.com.cn/Article/CDMD-10300-1013340770.htm
|
徐丽丽, 郑晓琴, 邓小东, 等. 2010. 0908号台风"莫拉克"路径异常及造成台南暴雨灾害的诊断分析[J]. 海洋预报, 27(3): 45-52. Xu Lili, Zheng Xiaoqin, Deng Xiaodong, et al. 2010. Diagnosis analysis of 0908 "Morakot" track abnormalities and disasters caused by heavy rains in Tainan[J]. Marine Forecasts (in Chinese), 27(3): 45-52. DOI:10.3969/j.issn.1003-0239.2010.03.009
|
Yang M J, Zhang Dalin, Huang H L. 2008. A modeling study of typhoon Nari (2001) at landfall. Part Ⅰ:Topographic effects[J]. J. Atmos. Sci., 65(10): 3095-3115. DOI:10.1175/2008JAS2453.1
|
Yeh T C, Elsberry R L. 1993a. Interaction of typhoons with the Taiwan orography. Part Ⅰ:Upstream track deflections[J]. Mon. Wea. Rev., 121(12): 3193-3212. DOI:10.1175/1520-0493(1993)121<3193:IOTWTT>2.0.CO;2
|
张建海, 黄汉中, 何勇. 2011. 台风"莫拉克"路径诊断分析和模拟[J]. 气象科技, 39(2): 182-189. Zhang Jianhai, Huang Hanzhong, He Yong. 2011. Diagnosis and simulation of track of typhoon Morakot[J]. Meteorological Science and Technology (in Chinese), 39(2): 182-189. DOI:10.3969/j.issn.1671-6345.2011.02.009
|
周仲岛, 于宜强, 凤雷, 等. 2010. 莫拉克台风综观环境以及降雨特征分析[J]. 大气科学(台湾地区气象学会主办), 38(1): 21-38. Zhou Zhongdao, Yu Yiqiang, Feng Lei, et al. 2010. Synoptic environment and rainfall characteristics of typhoon Morakot (0908)[J]. Atmospheric Sciences (in Chinese), 38(1): 21-38.
|
 2018, Vol. 42


