2 中国科学院大气物理研究所大气科学和地球流体力学数值模拟国家重点实验室,北京 100029
3 中国科学院大学,北京 100049
4 南京信息工程大学气象灾害教育部重点实验室/气候与环境变化国际合作联合实验室,南京 210044
2 State Key Laboratory of Numerical Modeling of Atmospheric Sciences and Geophysical Fluid Dynamics, Institute of Atmospheric Physics, Chinese Academy of Sciences, Beijing 100029
3 University of Chinese Academy of Sciences, Beijing 100049
4 Key Laboratory of Meteorological Disaster, Ministry of Education (KLME)/ Joint International Research Laboratory of Climate and Environment Change (ILCEC), Nanjing University of Information Science & Technology, Nanjing 210044
夏季亚洲季风区是热带外重要的水汽源和向平流层的物质传输通道(吕达仁等,2008;Randel et al., 2010;卞建春等,2011;Yu et al., 2017;Lelieveld et al., 2018),对平流层水汽也有重要贡献(Gettelman et al., 2004;Rolf et al., 2018)。研究表明,青藏高原是夏季亚洲季风区水汽含量最高、水汽向平流层传输最强的地区(Fu et al., 2006;占瑞芬和李建平,2008a;陈斌等,2009;Bian et al., 2012;唐南军等,2019)。
夏季青藏高原及周边地区上对流层—下平流层(upper troposphere and lower stratosphere,简称UTLS)高水汽含量的形成和维持与对流活动、南亚高压和大气温度密切相关(Wright et al., 2011;陈斌等,2012;Uma et al., 2014)。一般认为,夏季青藏高原地区上对流层的水汽主要受对流垂直输送的影响(James et al., 2008;Randel et al., 2015),深对流还能在平流层下层引起冷异常,影响平流层下层的水汽含量(Randel and Park, 2006;Zhang et al., 2016)。而UTLS水汽的水平分布则取决于南亚高压的水平输送和围困作用(Park et al., 2007, 2008;陈斌等,2011)。夏季青藏高原地区上对流层更高的温度使气柱可以包含更多的水汽(Wu et al., 2015;吴国雄等,2018),对流层顶的温度则决定了进入平流层下层水汽含量的多少(陈斌等,2009;Wang et al., 2015;Birner and Charlesworth, 2017)。
青藏高原及周边地区UTLS水汽具有明显的季节和季节内变化特征(占瑞芬和李建平,2008b;毕云等,2008),其中季节变化与季风的进退有关(田红瑛等,2014;Santee et al., 2017),而季节内变化则取决于对流活动和南亚高压的变化。Zhang et al.(2016)认为,夏季青藏高原南侧对流系统自东向西的移动是导致平流层下层水汽含量季节内变化的重要因子。Yan et al.(2011)的结果表明,当100 hPa南亚高压表现为青藏高原模态时,青藏高原地区为水汽含量异常高值区,伊朗高原地区为水汽含量异常低值区,当南亚高压表现为伊朗高原模态时则相反。而南亚高压与中纬度天气系统的相互作用会使UTLS水汽分布发生不可逆的改变(Dethof et al., 1999;Ploeger et al., 2013)。此外,上对流层水汽可以通过释放潜热影响非绝热加热梯度来改变位涡分布,进而影响南亚高压的强度,这在南亚高压东南部最为显著(Garny and Randel, 2013)。
夏季青藏高原地区UTLS水汽也有显著的年际变化及长期变化趋势。在年际时间尺度上,夏季青藏高原地区UTLS水汽与季风强弱、南亚高压强度和中心所在位置密切相关,此外还与ENSO、准两年振荡等有一定的联系(Kunze et al., 2010,2016;Randel et al., 2015;黄莹等,2017;屠厚旺等,2018)。而在年代际时间尺度上,夏季青藏高原地区上对流层水汽含量的变化与全球变暖有关(Xu et al., 2008)。然而受观测资料时间长度和数量的限制,上述关于UTLS水汽年际和年代际变化的研究结果还存在一定的不确定性。
夏季是亚洲季风区及青藏高原影响物质及水汽向平流层传输的关键时段,青藏高原及周边地区水汽的多少以及分布特征,对于该地区对流层水汽向平流层传输可能起了决定性作用。因此,关注该地区夏季UTLS水汽分布的总体异常特征,分析其与亚洲季风主要系统南亚高压以及相关对流活动的关系,是理解该地区水汽向平流层传输异常的首要环节。本文利用再分析资料,结合卫星观测水汽数据,揭示夏季青藏高原及周边地区水汽分布的年际异常型,并从绝热、非绝热传输角度,说明主要水汽异常型的形成原因。结果将为理解亚洲季风区影响水汽向平流层的传输强度及通道提供依据。
本文的框架如下:第2部分介绍本文用到的资料和方法。第3部分给出青藏高原及周边地区水汽质量的EOF(empirical orthogonal function)主导分布型。第4部分分析水汽质量分布型与对流活动和南亚高压的关系。第5部分分析水汽质量绝热和非绝热输送的分别作用。第6部分是对全文的总结和讨论。
2 资料和方法 2.1 资料前人对多套资料对比的结果表明,ERA-Interim(European Centre for Medium-Range Weather Forecasts Interim Re-Analysis)再分析资料对青藏高原及周边地区上对流层水汽时空分布的表征与卫星观测最接近(Jiang et al., 2015;Davis et al., 2017;唐南军等,2020),其已广泛用于青藏高原及周边地区上对流层水汽分布、演变和传输的研究。因此,本文所使用的再分析资料为ERA-Interim的大气三维风场、位势高度、温度、比湿以及地面气压数据。资料时段为1979年至2013年,时间分辨率为6小时,水平分辨率为1°×1°,垂直范围从1000 hPa到1 hPa共37层。所基于的数据为逐日的月平均资料。鉴于青藏高原及周边地区的水汽含量一般在7~8月最高(唐南军等,2020),因此本文的分析主要针对每年的7~8月。
为了验证由再分析资料得到的水汽异常型,我们采用了SWOOSH(Stratospheric water and ozone satellite homogenized)卫星资料(Davis et al., 2016)。本文用到的是月平均的水汽产品,资料时段为2004年到2017年,水平分辨率为20°×5°,垂直范围从316 hPa到1 hPa共31层。此外,我们还采用了NCEP向外大气长波辐射(outgoing longwave radiation,简称OLR)资料,时段为1979年至2013年,时间分辨率为6小时,水平分辨率为2.5°×2.5°,用以代表对流活动的强弱。
在分析水汽质量分布的年际异常之前,我们首先去除水汽质量数据的长期线性趋势。本文选择用温度递减率定义的热力对流层顶。文中水汽含量统一用体积混合比Q(单位,ppm;1 ppm=10−6)表示。以水汽含量纬向偏差百分比表征水汽含量的纬向差异,定义为
| $ \left({{Q_{\rm{\lambda }}} - \overline {{Q_{\rm{\lambda }}}} } \right)/\overline {{Q_{\rm{\lambda }}}} \times 100\%, $ | (1) |
其中,Qλ为纬度带平均的水汽值,
| $ \left({{Q_{\rm{c}}} - \bar Q} \right)/\bar Q \times 100\%, $ | (2) |
其中,Qc为合成的水汽值,
| $\frac{{\partial mq}}{{\partial t}} = - \frac{1}{{R\cos \phi }}\frac{{\partial muq}}{{\partial \lambda }} - \frac{1}{{R\cos \phi }}\frac{{\partial mvq\cos \phi }}{{\partial \phi }} - \frac{{\partial mq\dot \theta }}{{\partial \theta }} + S,$ | (3) |
其中,
| ${M_q}\left({{\theta _i}} \right) = \int_0^1 {{m_\sigma }q} H({\theta _i}{\rm{,}}{\theta _{i + 1}}{\rm{,}}\theta (\sigma)){R^2}\cos \phi {\rm{d}}\lambda {\rm{d}}\phi {\rm{d}}\sigma,$ | (4) |
| $F_u^{{\rm{ad}}}\left({{\theta _i}} \right) = \int_0^1 {{m_\sigma }qu} H({\theta _i}{\rm{,}}{\theta _{i + 1}}{\rm{,}}\theta (\sigma))R\cos \phi {\rm{d}}\lambda {\rm{d}}\sigma,$ | (5) |
| $F_v^{{\rm{ad}}}\left({{\theta _i}} \right) = \int_0^1 {{m_\sigma }qv} H({\theta _i}{\rm{,}}{\theta _{i + 1}}{\rm{,}}\theta (\sigma))R{\rm{d}}\phi {\rm{d}}\sigma,$ | (6) |
| $ F_\theta ^{\rm{d}}\left({{\theta _i}} \right) = \int_0^1 {{m_\sigma }q} {\dot \theta _m}H({\theta _{i - 1/2}},{\theta _{i + 1/2}},\theta (\sigma)){R^2}\cos \phi {\rm{d}}\lambda {\rm{d}}\phi {\rm{d}}\sigma,$ | (7) |
其中,
利用等熵坐标下的水汽质量收支方程(3)和Yu et al.(2014,2017)计算大气质量的方法,得到水汽质量绝热和非绝热传输要素。首先利用
参考张琼等(2000)对南亚高压强度和中心位置的定义,200 hPa上南亚高压的强度定义为(0°~60°N,20°~140°E)范围内,所有位势高度值大于12520 gpm格点的位势高度值与该值之差的总和。南亚高压中心位置则定义为:7~8月平均的西风零线上位势高度最高的格点。
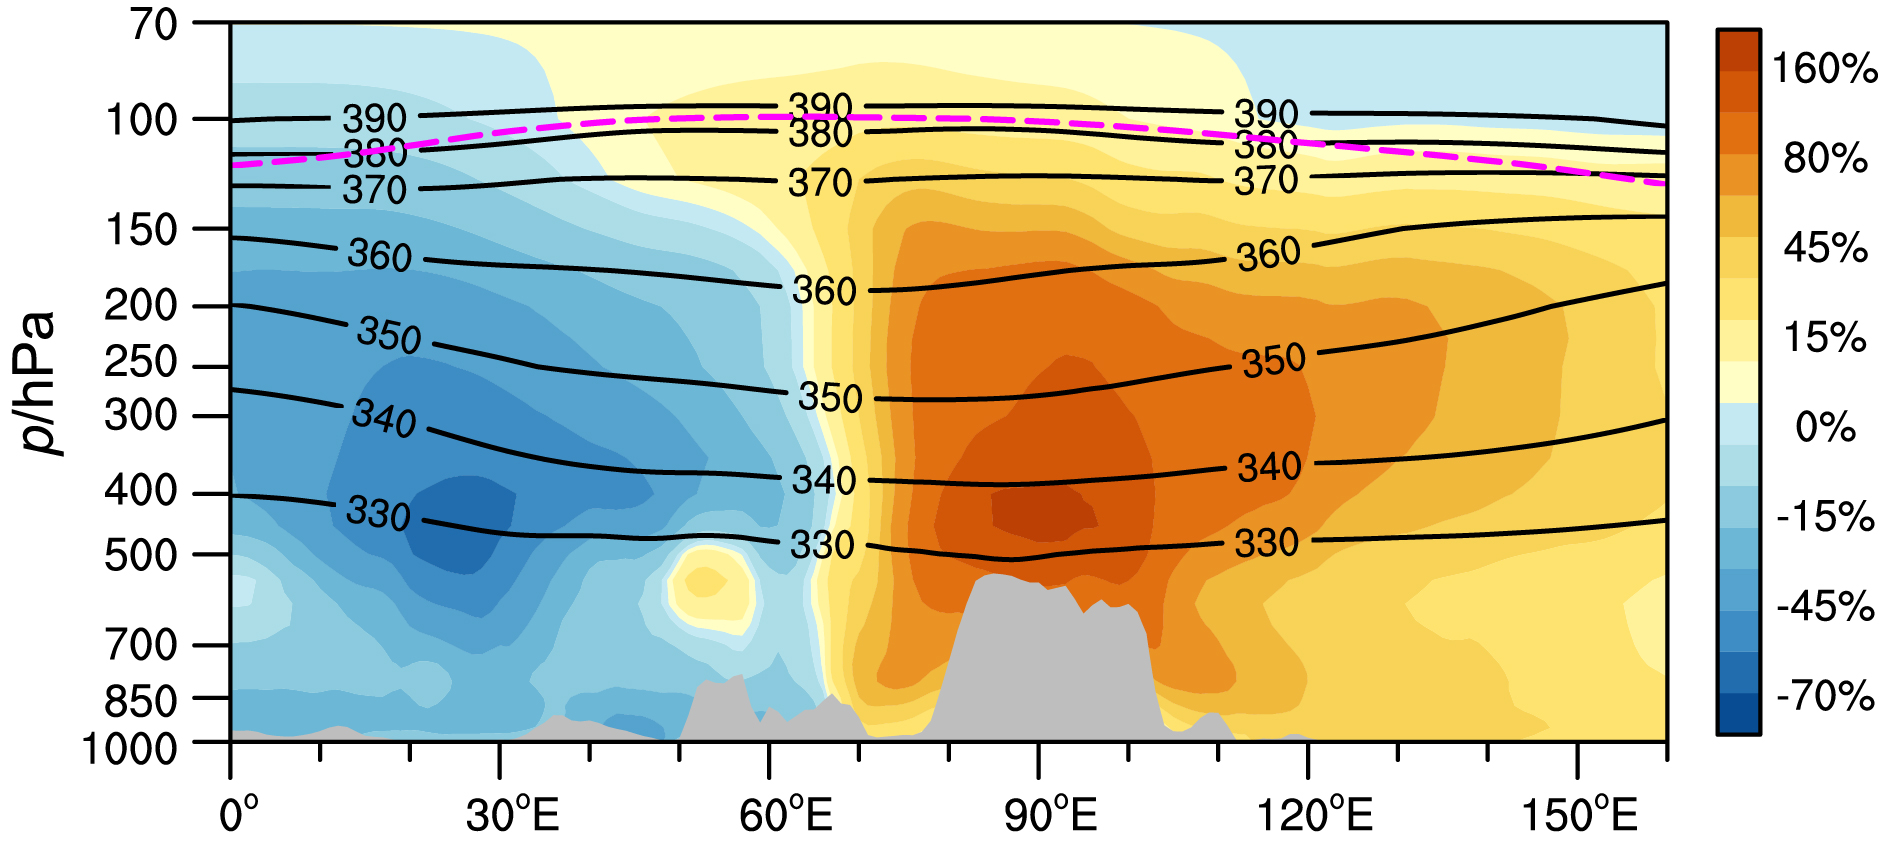
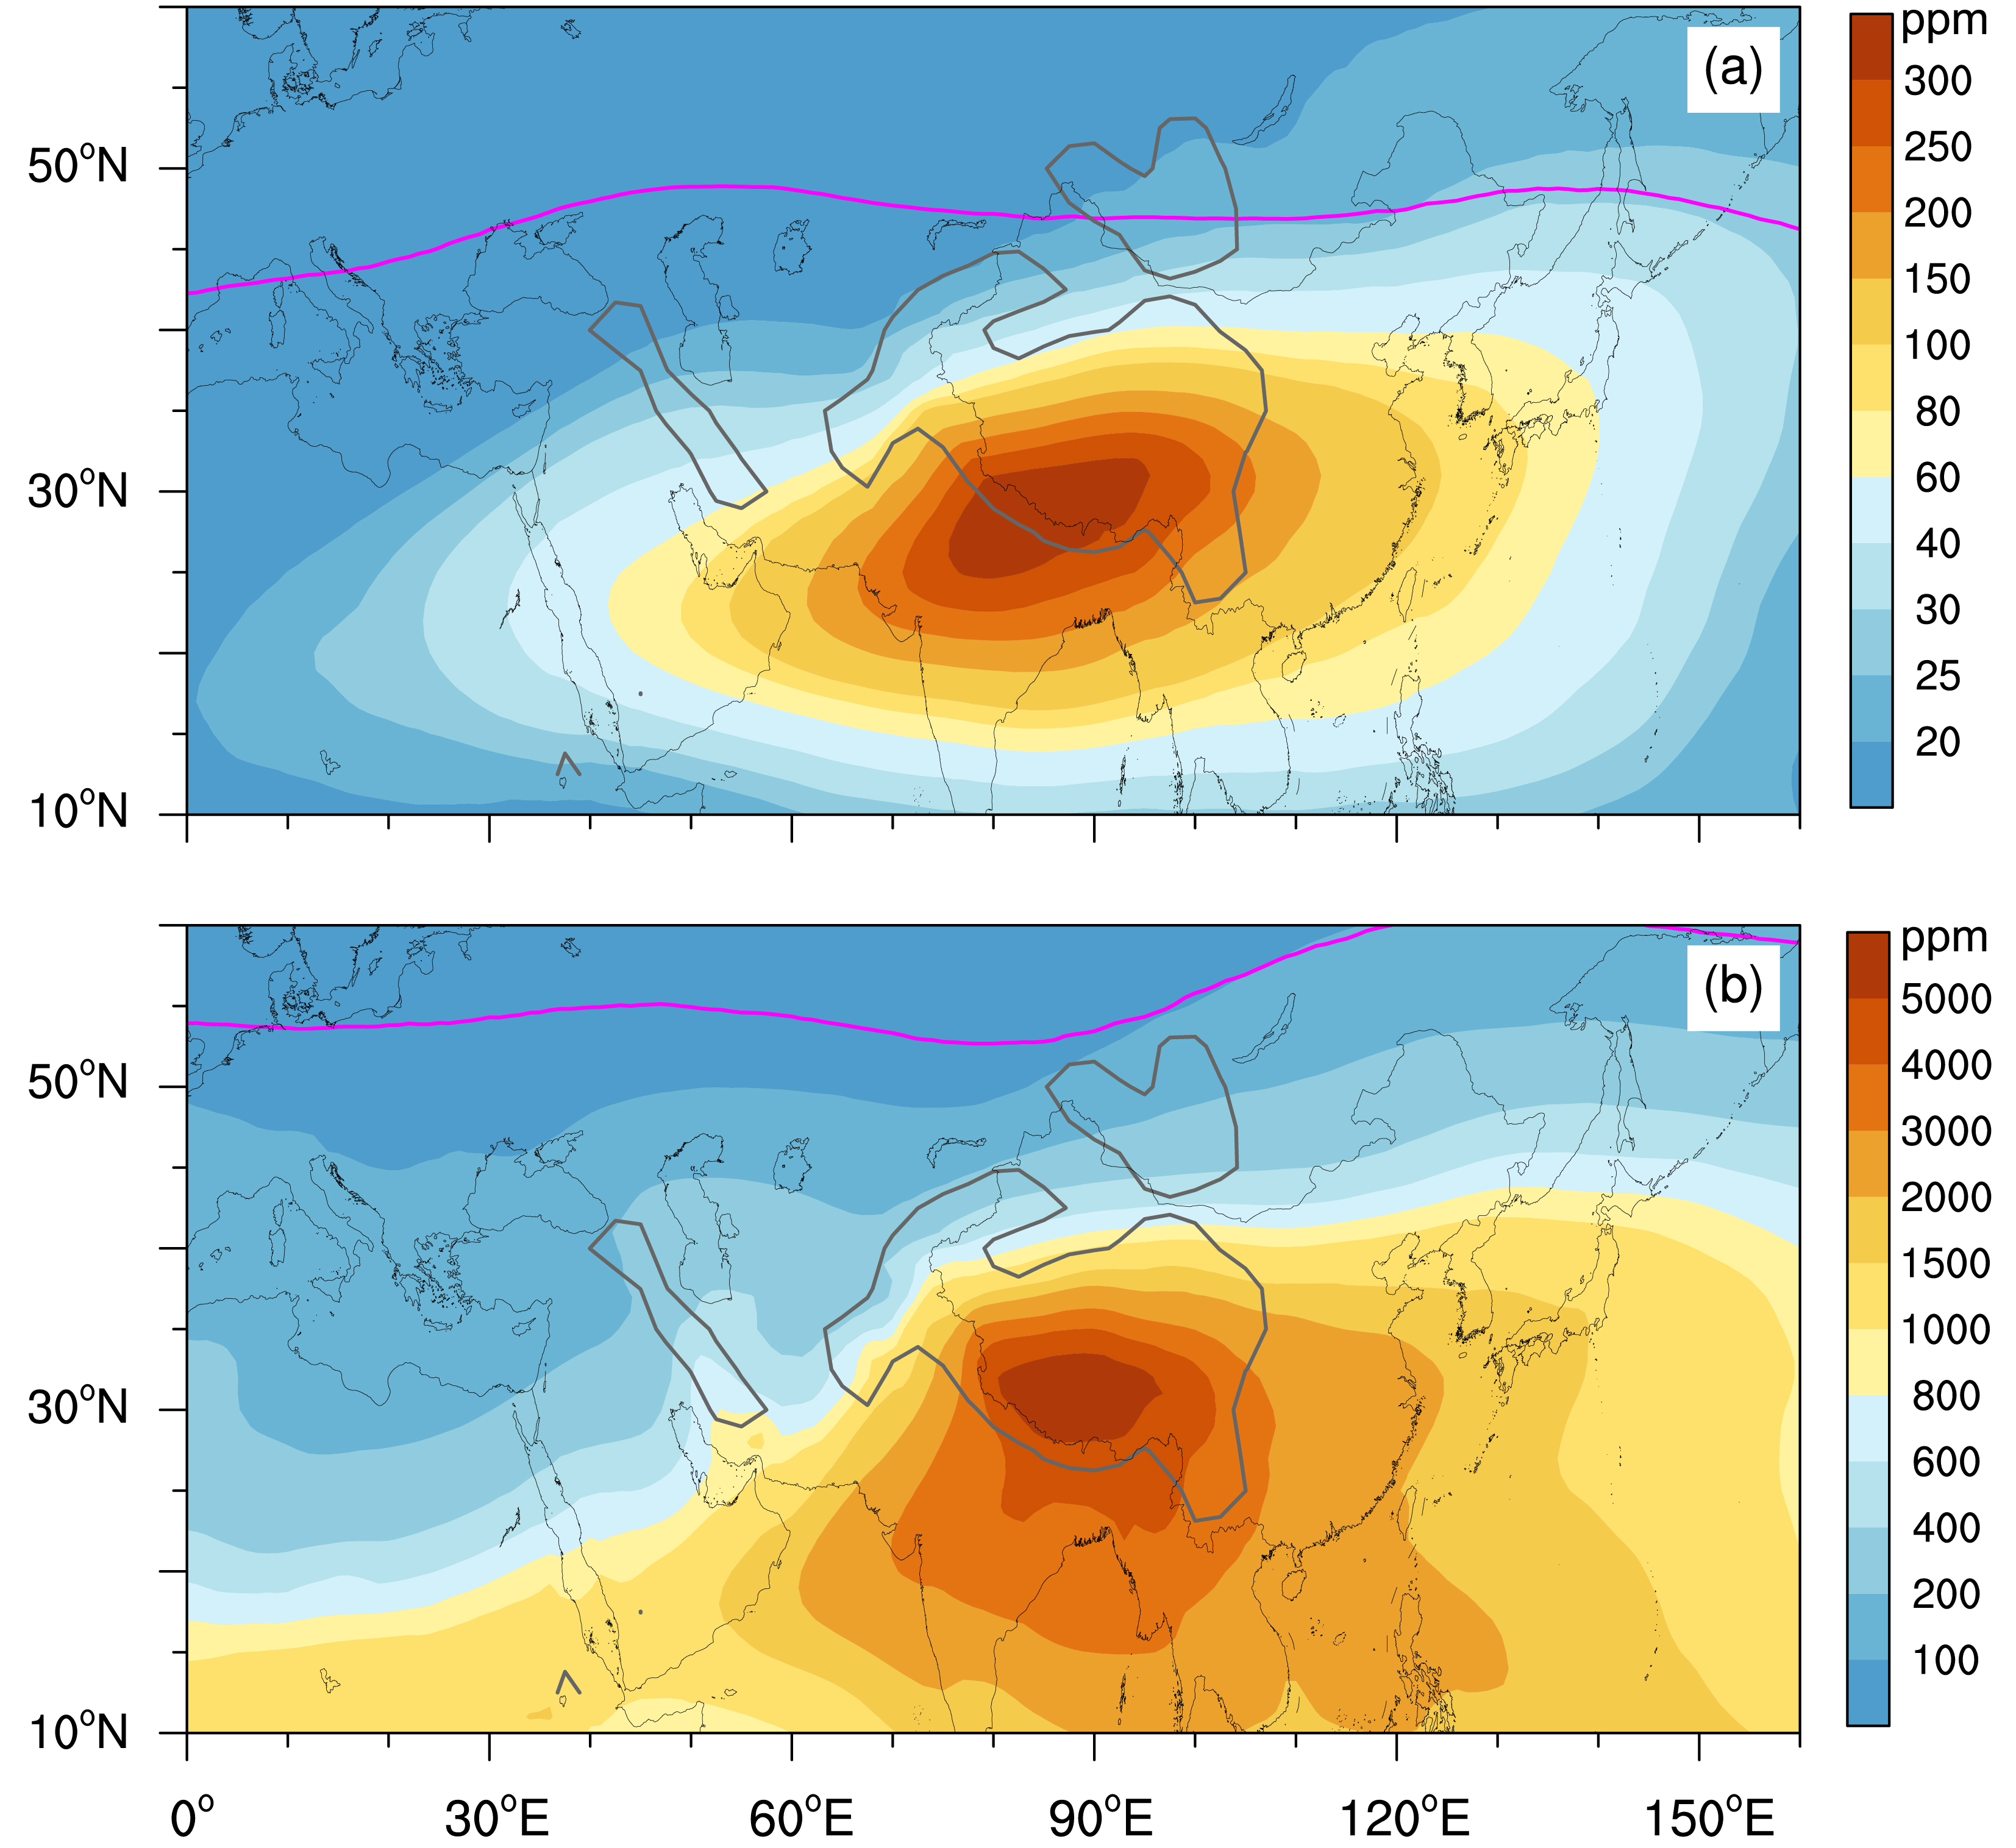
3 夏季青藏高原上对流层水汽质量异常主导分布型 3.1 前3个EOF主导特征向量水平分布型在分析水汽质量异常分布型之前,我们首先来看气候平均的水汽分布。图1给出了青藏高原地区气候平均的7~8月水汽含量、等熵面和对流层顶的纬向垂直分布。由图可见,青藏高原地区为纬圈方向水汽含量的高值区,其中330~360 K层次为高水汽含量中心;青藏高原高水汽带以西则相反,为平均的水汽含量低值区。由水汽含量水平分布可知,青藏高原南侧为水汽含量高值中心,在350~360 K层次呈东西分布(图2a),在330~340 K层次则呈西南西—东北东分布(图2b)。
|
图 1 1979~2013年ERA-Interim资料平均的7~8月大气水汽含量的纬向偏差百分比(填色)、位温(黑色实线,单位:K)和对流层顶(粉色虚线)沿青藏高原纬度带(20°~40°N)的气压—经度剖面 Fig. 1 Height–longitude cross sections of the percentage differences in the water vapor content relative to zonal mean (shading), potential temperature (black solid lines, units: K), and tropopause (pink dashed lines) averaged over the Tibetan Plateau latitude belt (20°–40° N) in July–August from 1979 to 2013, based on ERA-Interim data |
|
图 2 1979~2013年ERA-Interim资料平均的7~8月大气水汽含量(填色,单位:ppm;1 ppm=10−6)在(a)350~360 K、(b)330~340 K层次的水平分布。粉色实线代表对流层顶的位置 Fig. 2 Horizontal distributions of water vapor content (shading, units: ppmv) averaged for (a) 350–360 K and (b) 330–340 K layers in July–August from 1979 to 2013, based on ERA-Interim data. Pink solid lines denote the tropopause location |
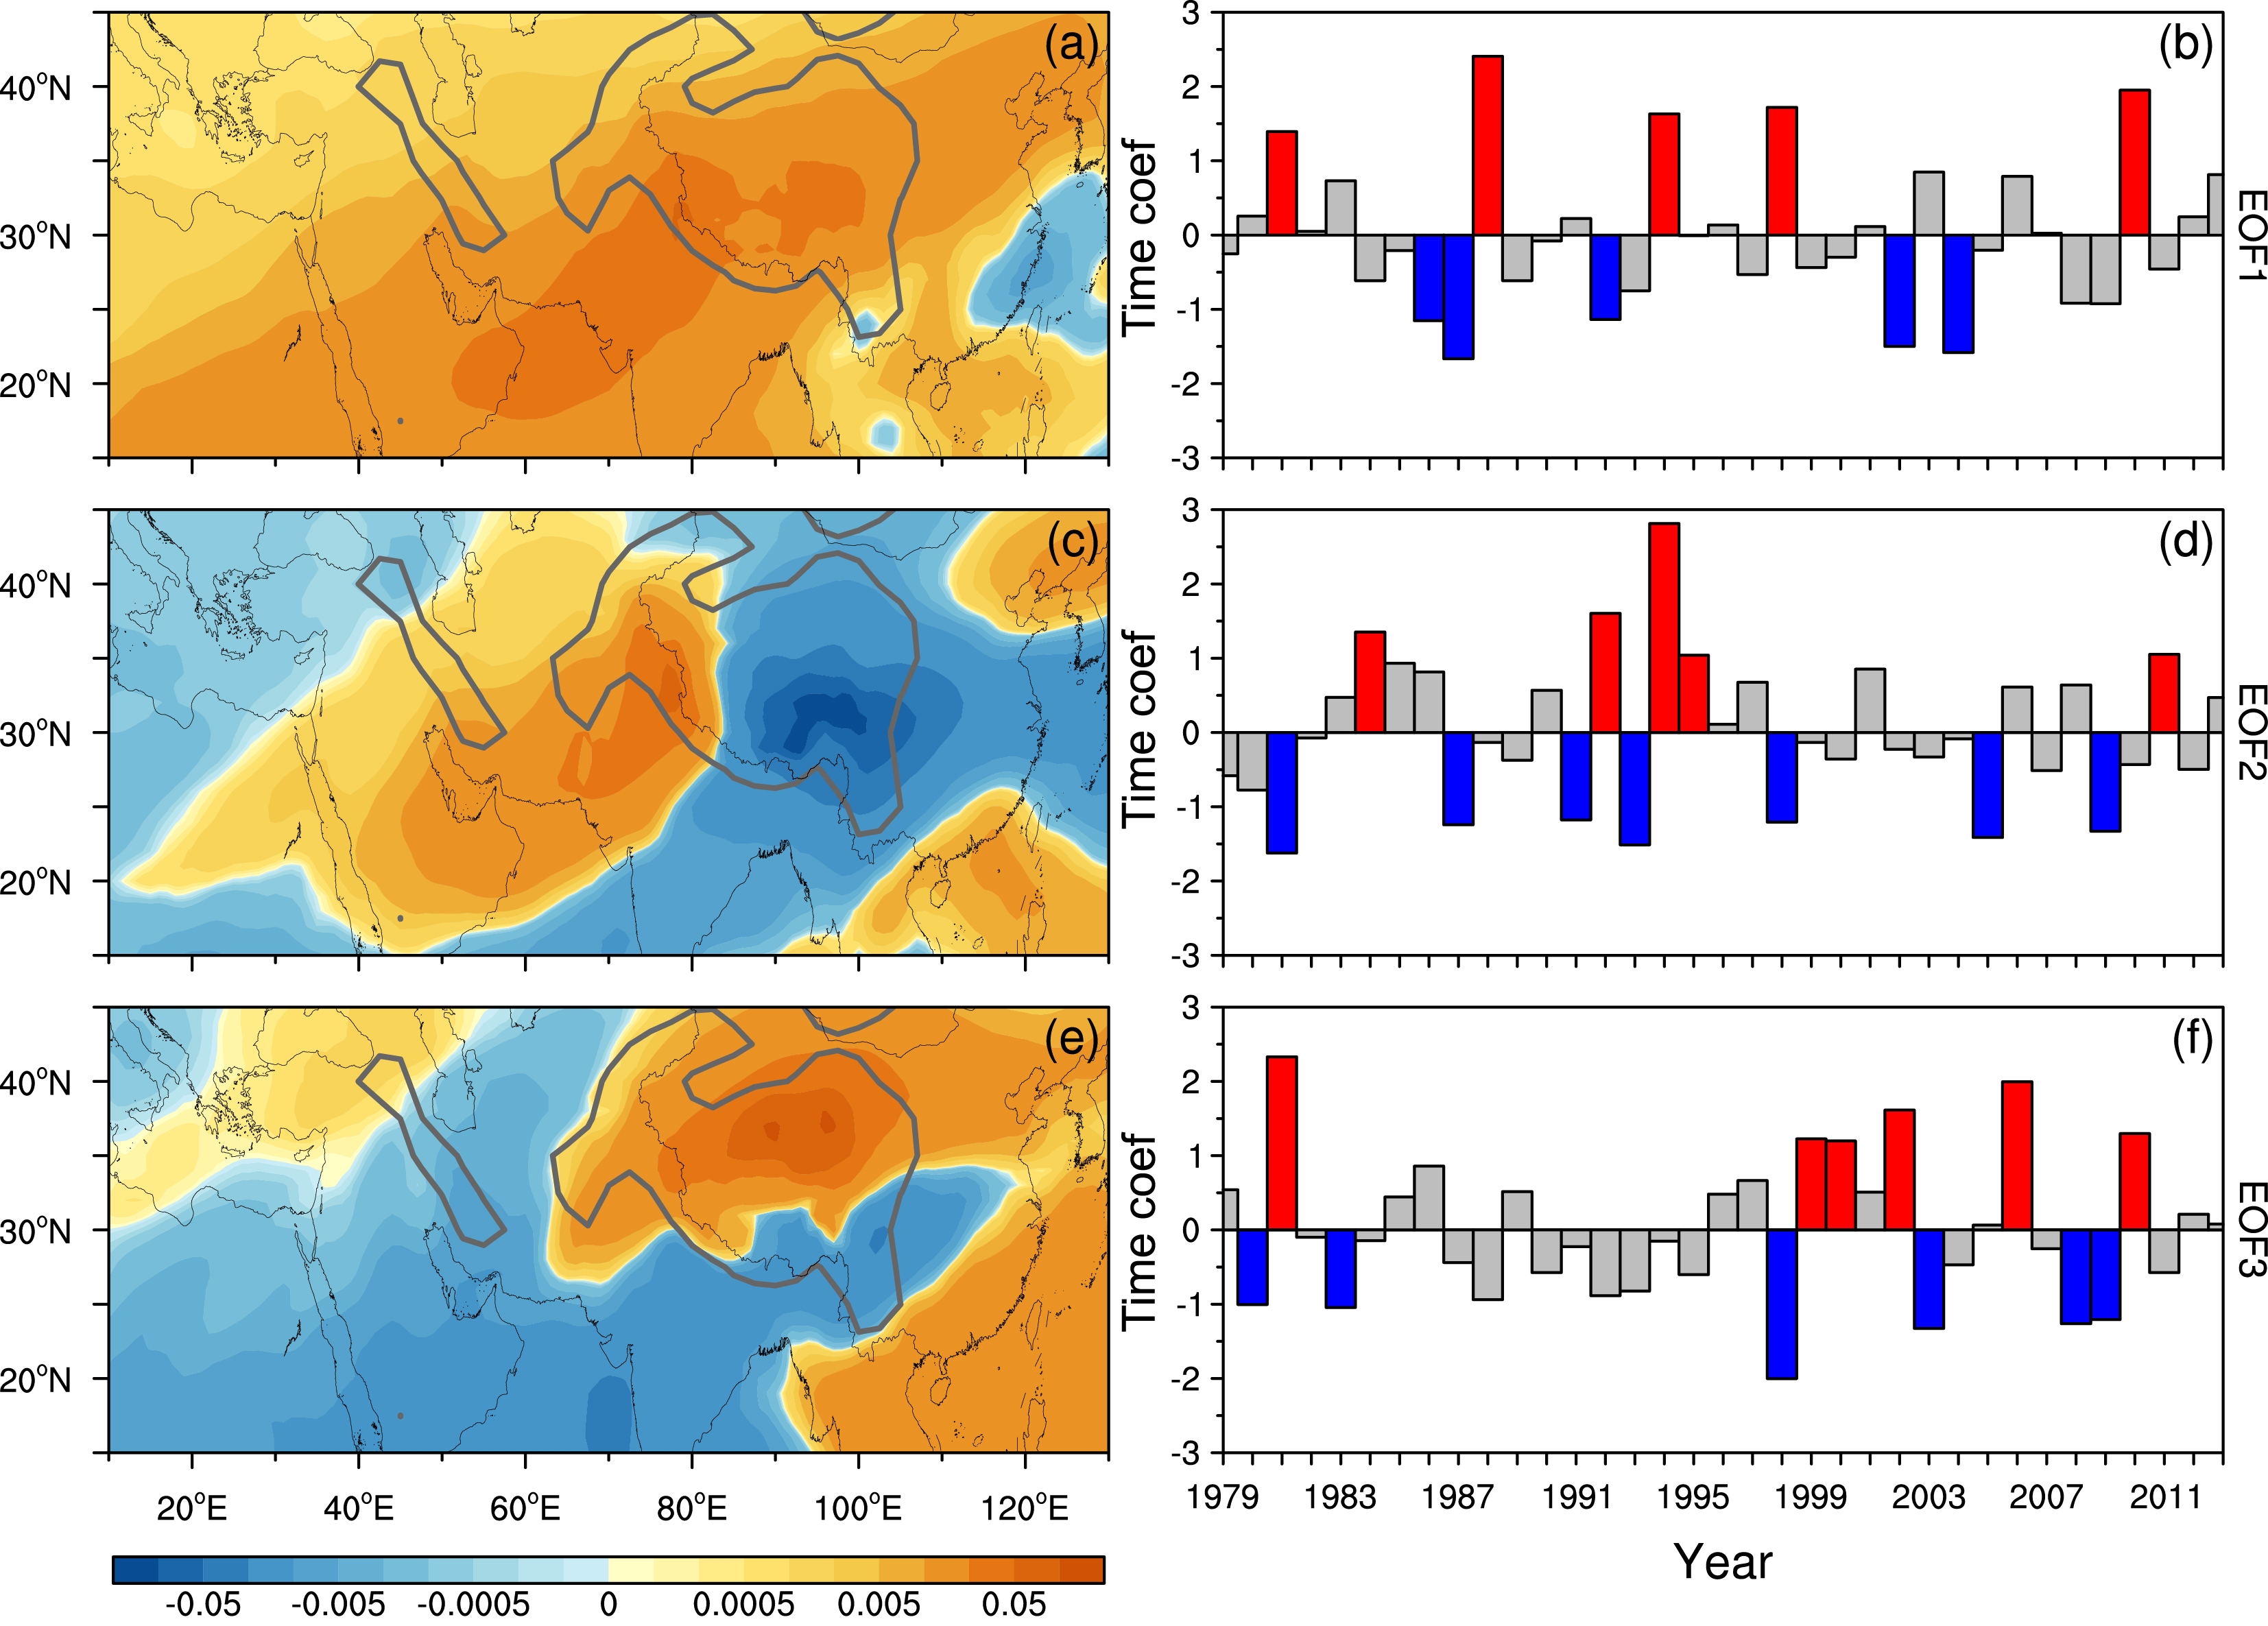
图3给出了青藏高原及周边地区7~8月330~360 K层次水汽质量距平EOF前3个特征向量的空间分布型及其时间系数,它们对总方差的贡献率分别为30.6%、21.4%和11.6%。利用特征值误差范围检验方法(魏凤英,2007),证实这3个特征向量的特征值都通过了显著性检验。由图3a可见,第1特征向量的值在青藏高原及周边地区基本上为正值,即该区域内水汽质量的变化表现为整体异常型,并且在青藏高原西南到印度西北地区最大,大值区在青藏高原地区基本呈西南—东北分布,与气候态的水汽分布相似。第2特征向量的值在青藏高原西部到伊朗高原为正值,青藏高原东部为负值,表现为东西偶极异常型(图3c)。第3特征向量的值在青藏高原北部为正值,青藏高原南侧为负值,表现为南北偶极异常型(图3e)。由3个EOF主导型时间系数的演变可知,它们都呈现显著的年际变化特征(图3b、d、f)。以特征向量的标准化时间系数绝对值大于1为标准,可分别选出正、负位相显著异常的年份,用于后文的合成分析。
|
图 3 1979~2013年ERA-Interim资料7~8月330~360 K层次水汽质量距平的前3个EOF特征向量(左列)及其标准化的时间系数(右列):(a,b)第1特征向量;(c,d)第2特征向量;(e,f)第3特征向量。(b、d、f)中,红(蓝)色柱表示标准化的时间系数大于1(小于−1) Fig. 3 First three empirical orthogonal function (EOF) modes (left column) and their normalized time coefficients (right column) of water-vapor-mass anomalies in the 330–360 K layers over the Tibetan Plateau in July–August from 1979 to 2013, based on ERA-Interim data: (a, b) First, (c, d) second, and (e, f) third EOF modes. The red and blue bars denote normalized time coefficients greater than 1 and less than −1, respectively |
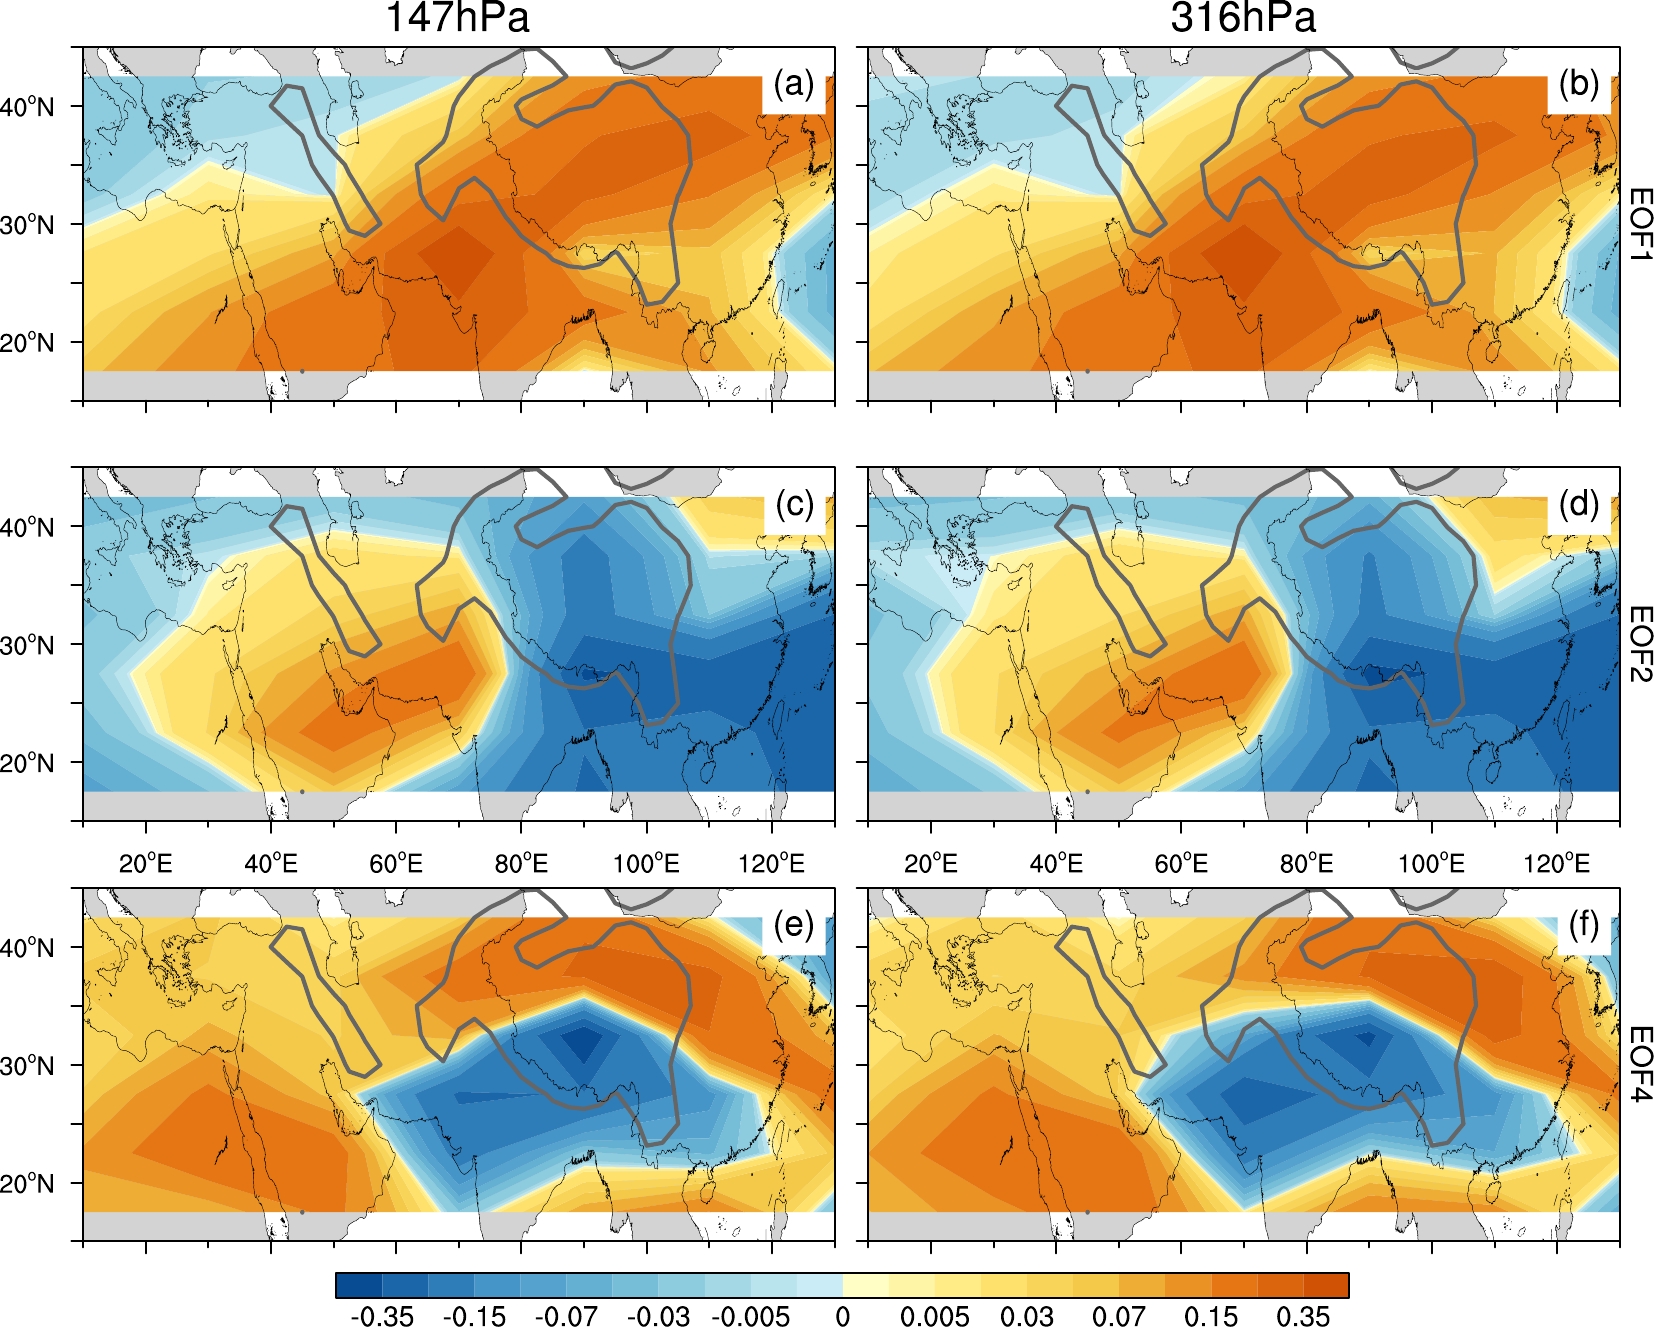
为了验证上述异常型,图4给出了用SWOOSH等压面水汽资料分析得到的第1、第2和第4特征向量的空间分布。它们对总方差的贡献率分别为47%、18.9%、6.5%(147 hPa)和46.8%、20.1%、6.3%(316 hPa)。由图4可见,两个等压面水汽异常的空间分布特征相似。特别是前两个特征向量的空间分布也都分别表现为整体异常型(图4a、b)和东西偶极异常型(图4c、d),与图3中ERA-Interim资料的结果十分一致。第4特征向量的分布表现为青藏高原北部和以西为正值,青藏高原南部及以南为正值,这与用ERA-Interim资料得到的南北偶极异常型在青藏高原地区相近(图4e、f)。而第4特征向量与用ERA-Interim资料得到的南北偶极异常型相差很大,这里我们不做分析。
|
图 4 2004~2017年SWOOSH资料7~8月147 hPa(左列)和316 hPa(右列)水汽含量距平的EOF特征向量:(a,b)第1、(c,d)第2和(e,f)第4特征向量 Fig. 4 EOF modes of the water-vapor-content anomalies at (a, c, e) 147 hPa and (b, d, f) 316 hPa in July–August from 2004 to 2017, based on SWOOSH data: (a, b) First, (c, d) second, and (e, f) fourth EOF modes |
以上EOF分析的结果表明,在年际时间尺度上,夏季7~8月青藏高原及周边地区上对流层的水汽分布有整体异常型、东西偶极异常型和南北偶极异常型。利用SWOOSH资料可重现前两个特征向量的分布型,部分重现第3个特征向量的分布型。
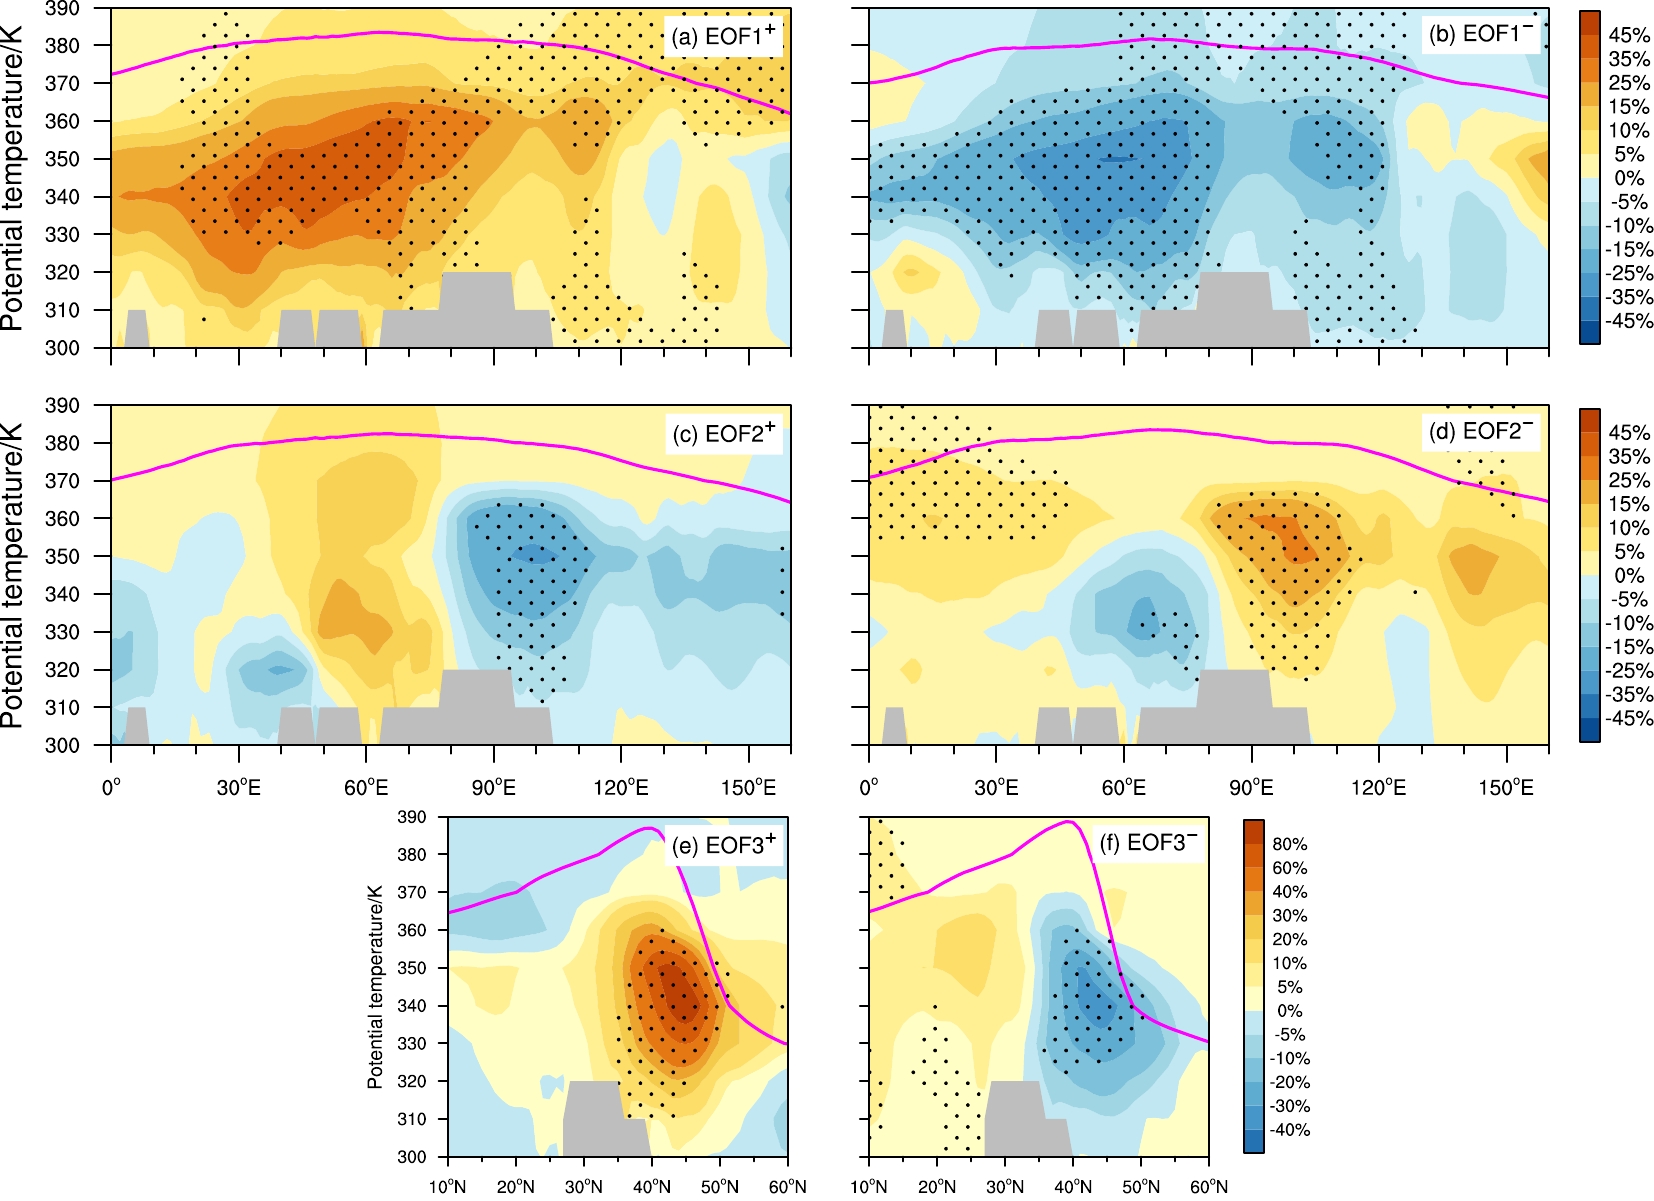
3.2 对应的水汽含量纬向垂直分布对应整体异常型、东西偶极异常型和南北偶极异常型,夏季7~8月青藏高原及周边地区的水汽含量分布在垂直方向上如何?图5给出了青藏高原纬度带(20°~40°N)7~8月水汽含量在前两个模态正/负位相年相对气候平均的偏差百分比的等熵—经度分布。整体异常型正位相年(整体偏多),青藏高原及周边地区上空水汽含量偏差百分比整层一致为正,330~360 K层次在伊朗高原地区偏差值最大,约达45%(图5a)。相反地,在整体异常型负位相年(整体偏少)青藏高原及周边地区上空水汽含量偏差百分比整层一致为负,最大负值中心在伊朗高原地区350 K层,为−35%(图5b)。因此,整体偏多时青藏高原及周边地区上空水汽含量都偏高,整体偏少时相反。
|
图 5 基于ERA-Interim资料合成的7~8月大气水汽含量相对气候平均的偏差百分比(填色)沿(a–d)青藏高原纬度带(20°~40°N)的等熵—经度剖面以及沿(e–f)青藏高原经度带(70°~105°E)的等熵—纬度剖面:水汽质量(a)整体偏多年、(b)整体偏少年、(c)西多/东少年、(d)西少/东多年、(e)北多/南少年以及(f)北少/南多年。粉色实线代表对流层顶的位置,打点区域表明水汽含量偏差通过了90%置信水平检验的区域 Fig. 5 (a–d) Height–longitude and (e–f) height–latitude cross sections of percentage differences in the composited water vapor content relative to climate mean (shading) over the Tibetan Plateau latitude belt (20°–40° N) and longitude belt (70°−105° E) in July–August, based on ERA-Interim data: Water vapor mass (a) whole region more years, (b) whole region less years, (c) west more/east less years, (d) west less/east more years, (e) north more/south less years, and (f) north less/south more years. Pink solid lines denote the tropopause location and black dots indicate significant differences in the water vapor content at the 90% confidence level |
东西偶极异常型时,青藏高原及周边地区东西方向上水汽含量有相反的异常分布。由图5c可见,东西偶极异常型正位相年(西多/东少)青藏高原西部到伊朗高原地区上空水汽含量偏差百分比整层为正值,最大偏差在330~340 K层次,约为15%。而青藏高原中东部370 K以下层次水汽含量偏差百分比多为负值,最大偏差出现在350 K层,约为−25%。东西偶极异常型负位相年(西少/东多),青藏高原西部到伊朗高原350 K及以下层次均为水汽含量偏差百分比负值区,最大偏低约为−15%,虽然在350 K以上层次水汽含量偏高,但仅在5%以内,远小于西多/东少年。而青藏高原中东部370 K以下层次则水汽含量显著偏高,也与西多/东少年相反。总之,西多/东少年青藏高原西部到伊朗高原上空水汽含量偏高,青藏高原中东部上空水汽含量偏低,西少/东多年则相反。
而南北偶极异常型时,青藏高原地区水汽含量在南北方向上有一致的反位相变化。其中在南北偶极异常型正位相年(北多/南少),青藏高原以北(35°~50°N)370 K以下层次水汽含量偏差百分比均比较大,其中340~350 K层次偏差百分比偏高超过80%(图5e);在青藏高原及以南地区,320~350 K层次水汽含量偏高,其他层次水汽含量均偏低,水汽含量偏差百分比在±10%以内。相反地,在南北偶极异常型负位相年(北少/南多),青藏高原以北370 K以下层次水汽含量均偏低,尤其是在340~350 K层次,偏差百分比接近−40%;在青藏高原及以南地区上空水汽含量都偏高,尤其是在350~360 K层次,偏差百分比为10%~20%(图5f)。总之,北多/南少时青藏高原以北上空水汽含量偏高,青藏高原及以南地区上空水汽含量偏低,北少/南多时相反。
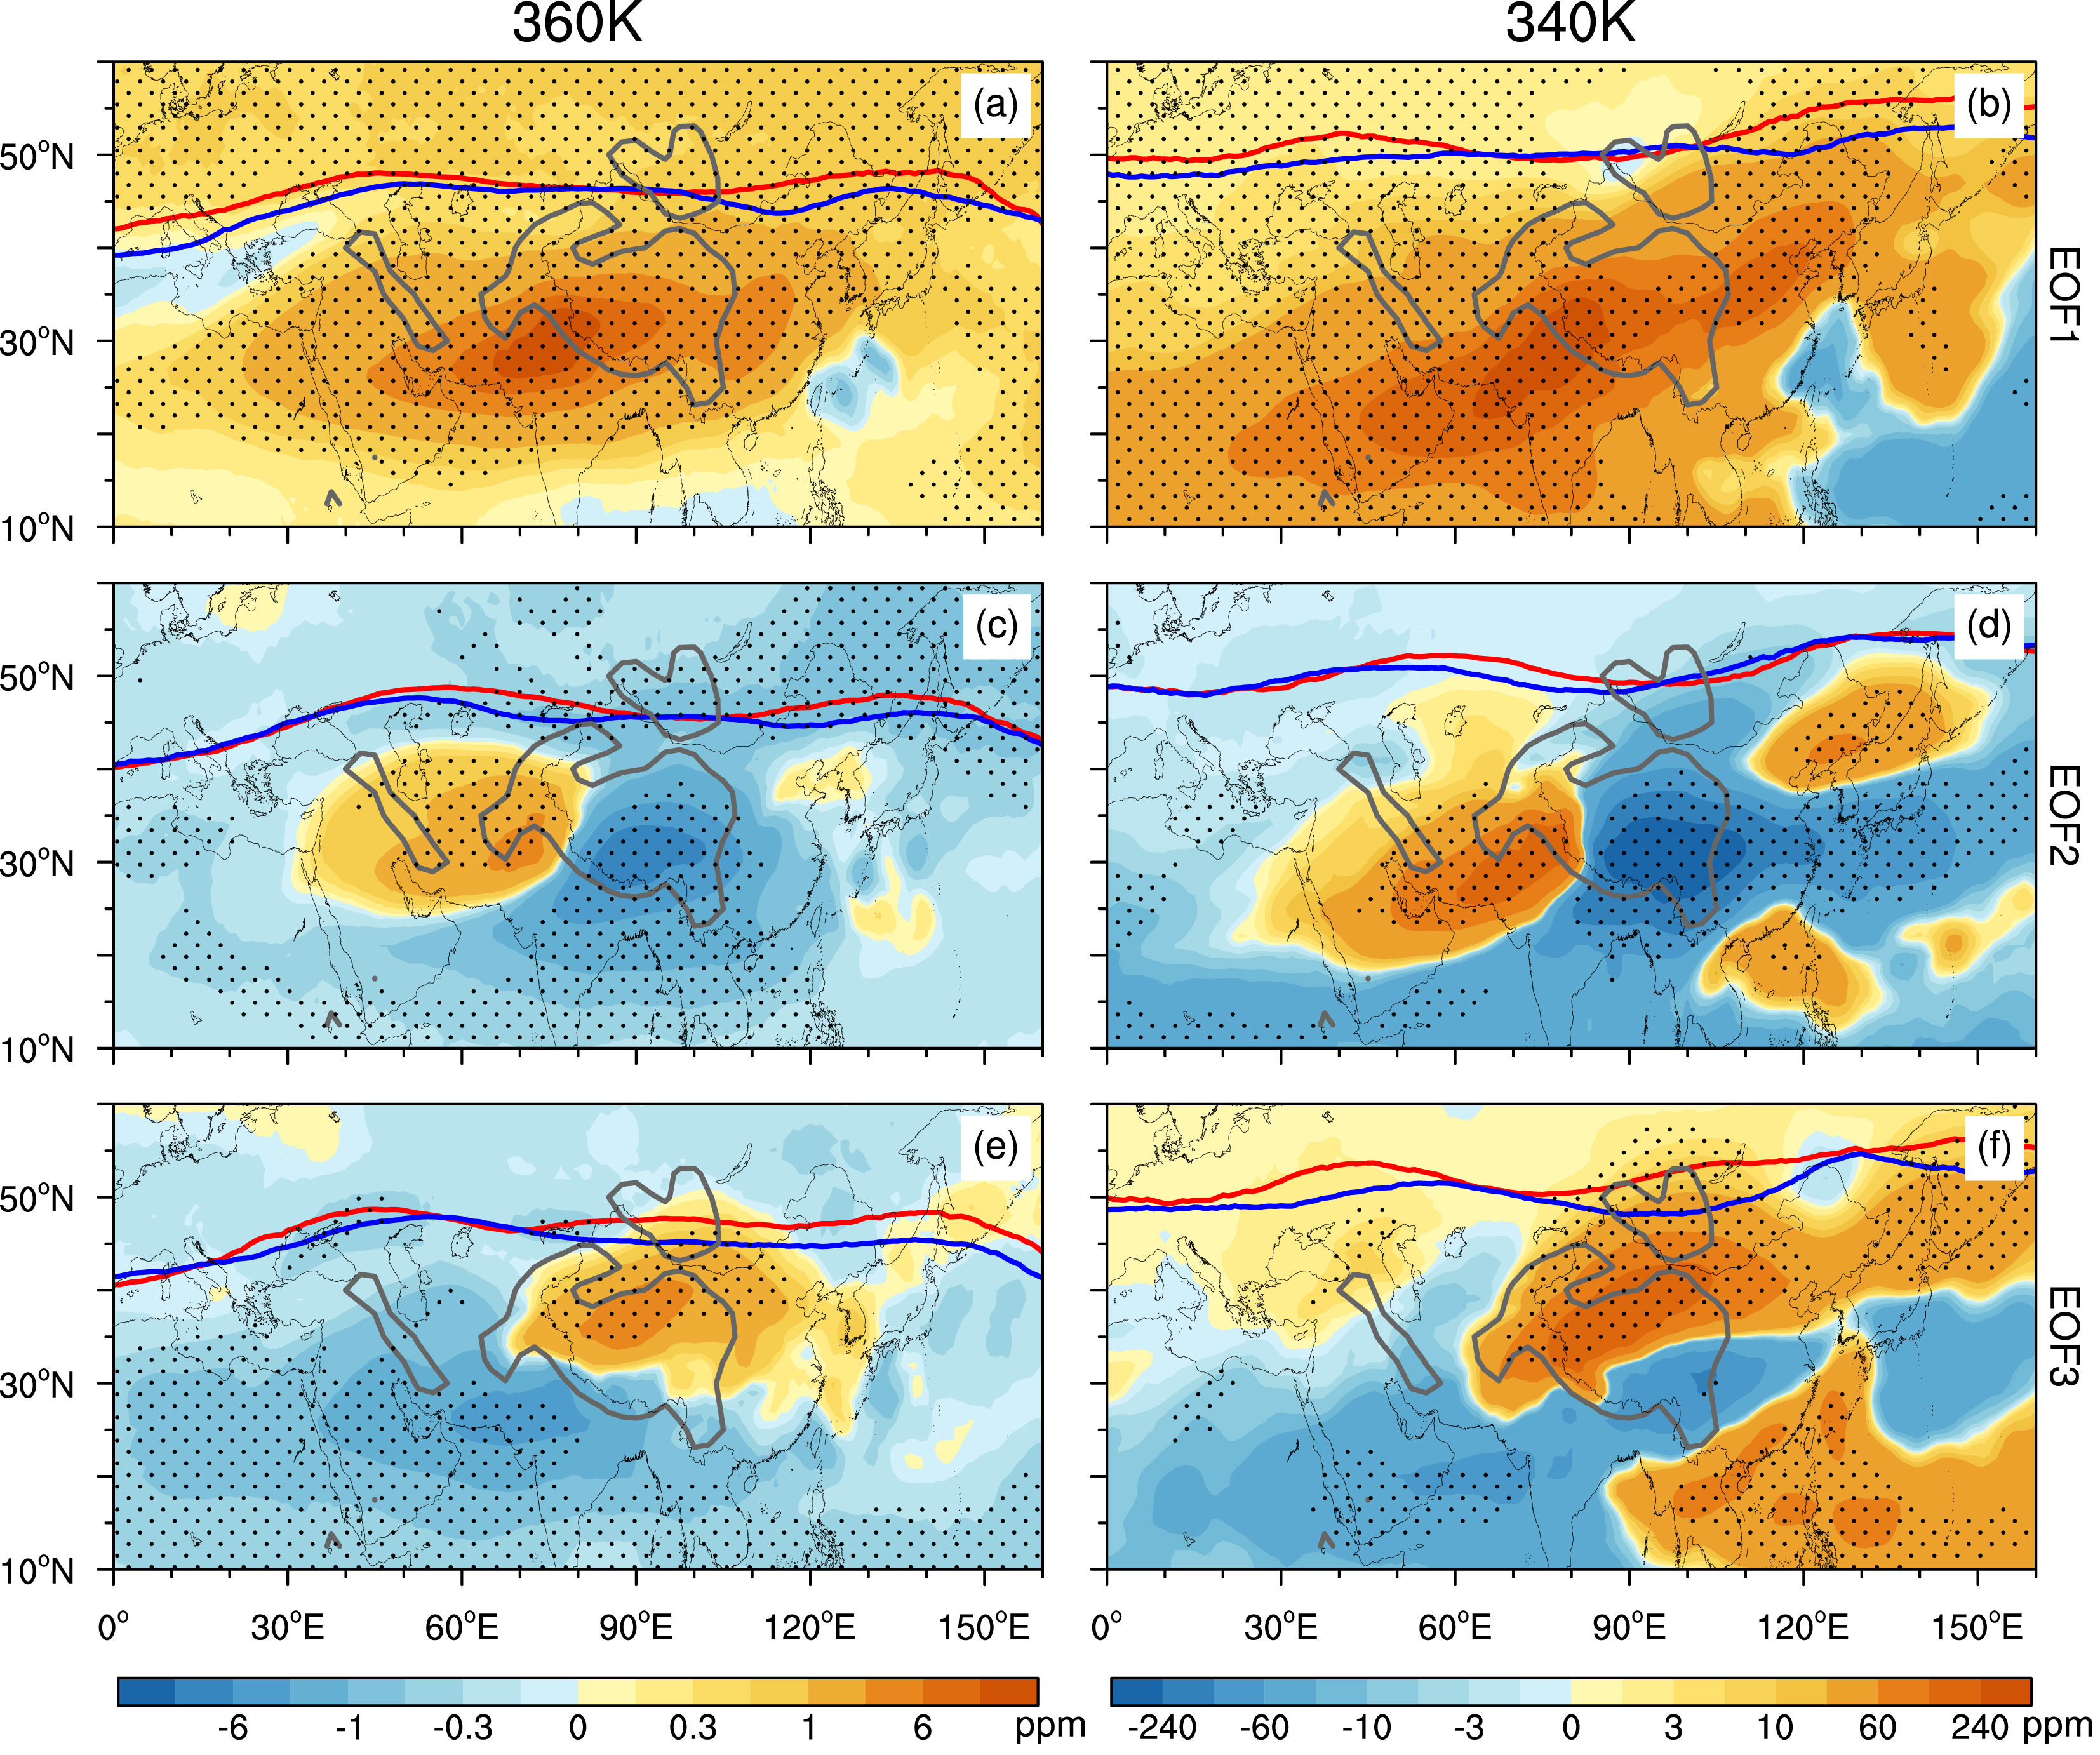
3.3 特征向量时间系数回归由以上分析可知,水汽质量分布的3个主导分布型都对应上对流层的水汽含量变率为最大,下面我们利用主导特征向量的时间系数回归得到上对流层水汽含量的分布,进一步验证上述水汽含量的异常分布。由图6可见,整体偏多时,副热带和中纬度地区的水汽含量有一致的变化。360 K层上副热带和中纬度地区水汽含量回归值大多为正值,水汽含量异常偏高,并在青藏高原西南地区存在正值中心(图6a)。340 K层上,除太平洋地区外,大部分地区水汽含量回归值也为正值,并在青藏高原西南和东北有正值中心(图6b)。回归的结果表明整体偏多时不仅青藏高原,其周边地区上对流层的水汽含量也异常偏高,并且与整体异常型特征向量的分布相似。
|
图 6 基于ERA-Interim资料水汽质量距平(a,b)第1、(c,d)第2、(e,f)第3特征向量EOF模态时间系数回归的7~8月大气水汽含量(填色,单位:ppm):360 K层(左列);340 K层(右列)。红色(蓝色)实线为正(负)位相显著异常年的对流层顶位置。打点区域表明水汽含量回归值通过了90%置信水平检验的区域 Fig. 6 Regression analysis of water vapor contents (shading, units: ppm) on the time coefficients of the water vapor mass anomalies (a–b) first, (c–d) second, and (e–f) third EOF modes in July–August, based on ERA-Interim data: (a, c, e) 360 K layer, (b, d, f) 340 K layer. The solid red (blue) lines denote the tropopause location in significantly abnormal positive (negative)-phase years. Black dots indicate the regressed significant water vapor contents at the 90% confidence level |
西多/东少分布时,青藏高原西部到伊朗高原与青藏高原中东部的水汽含量有相反的异常。360 K层上青藏高原西部到伊朗高原水汽含量回归值为正,水汽含量异常偏高,副热带和中纬度其他地区水汽含量回归值主要为负值,水汽含量异常偏低,并在青藏高原中东部有显著的负值中心(图6c)。340 K与360 K相似,只是在青藏高原东北、东南出现水汽含量回归的正值(图6d)。回归的结果表明在西多/东少分布时,青藏高原西部到伊朗高原上对流层的水汽含量异常偏高,青藏高原中东部则异常偏低,这与东西偶极异常型特征向量的分布也相似。
北多/南少分布时,青藏高原地区南北方向上水汽含量有相反的异常。360 K层上,青藏高原北侧水汽含量回归值有显著的正值中心,水汽含量异常偏高,其他地区水汽含量回归值大多为负值,并在青藏高原西南有显著的负值中心(图6e)。340 K层上有相似的结果,但在青藏高原东南和中纬度地区水汽含量回归值为正值(图6f)。回归的结果表明,北多/南少分布时青藏高原北(南)侧上对流层水汽含量异常偏高(低),这与南北偶极异常型特征向量的分布一致。总之,回归分析的结果表明,上对流层水汽含量的变化基本主导了青藏高原上空水汽质量的年际分布型。
4 水汽质量主导分布型对应的对流活动及南亚高压异常青藏高原及周边地区水汽输送的年际异常与水平和垂直环流的异常变化密切相关(占瑞芬和李建平,2012;Kunze et al., 2016)。接下来我们将分析3个水汽质量异常分布型与对流活动和南亚高压的关系(图7和图8)。
|
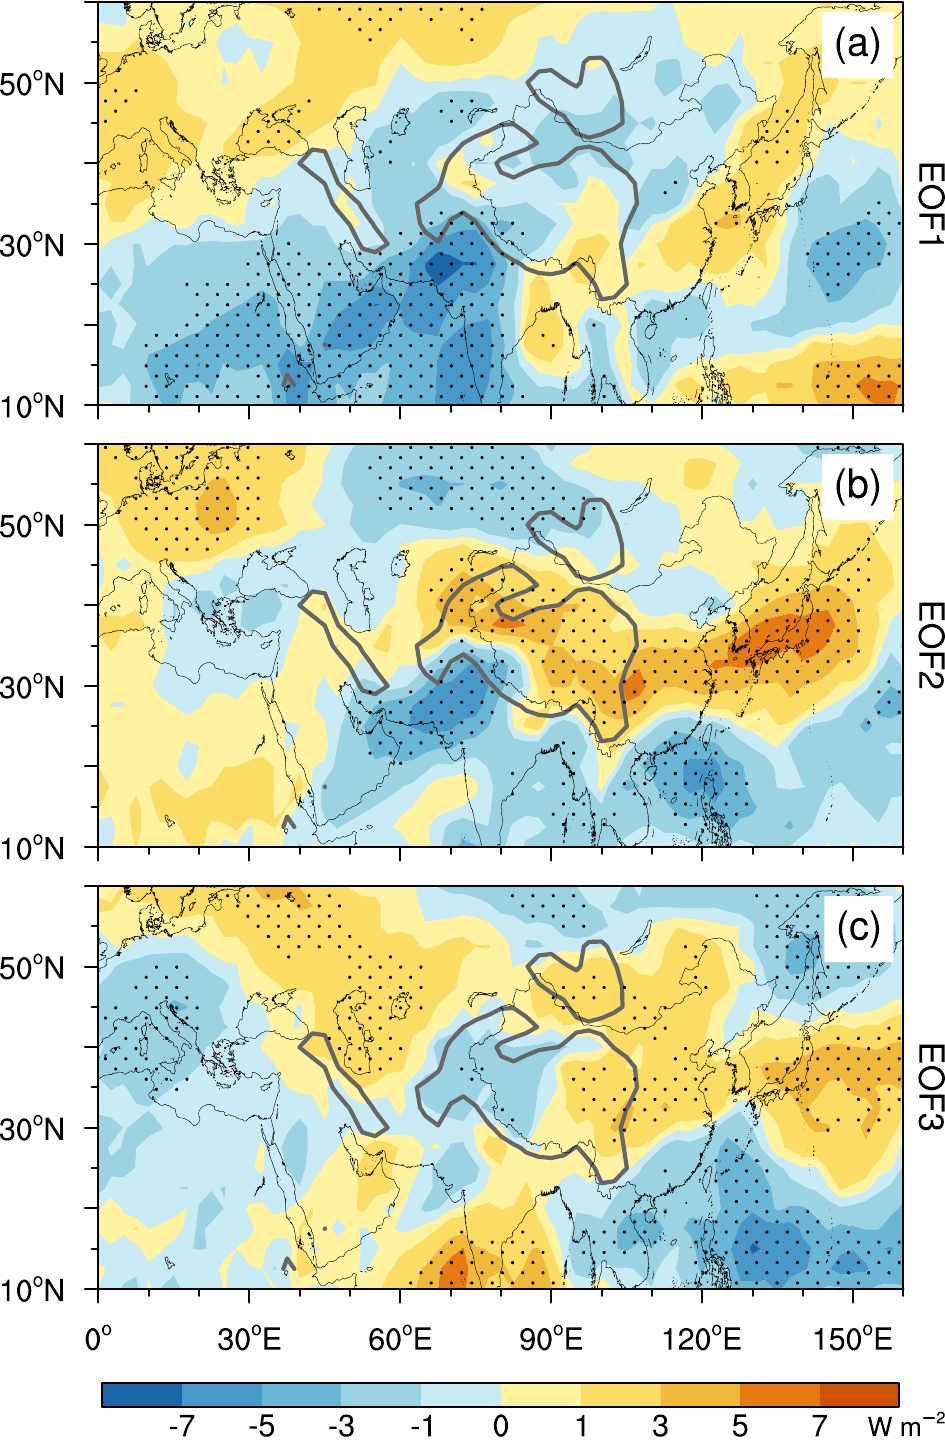
图 7 基于ERA-Interim资料水汽质量距平(a)第1、(b)第2、(c)第3特征向量EOF模态时间系数回归的7~8月OLR(填色,单位:W m−2)。打点区域表明OLR回归值通过了90%置信水平检验的区域 Fig. 7 Regression analysis of the outgoing longwave radiation (OLR; shading, units: W m−2) on the time coefficients of the water vapor mass anomalies (a) first, (b) second, and (c) third EOF modes in July–August, based on ERA-Interim data. Black dots indicate the regressed OLR significant at the 90% confidence level |
|
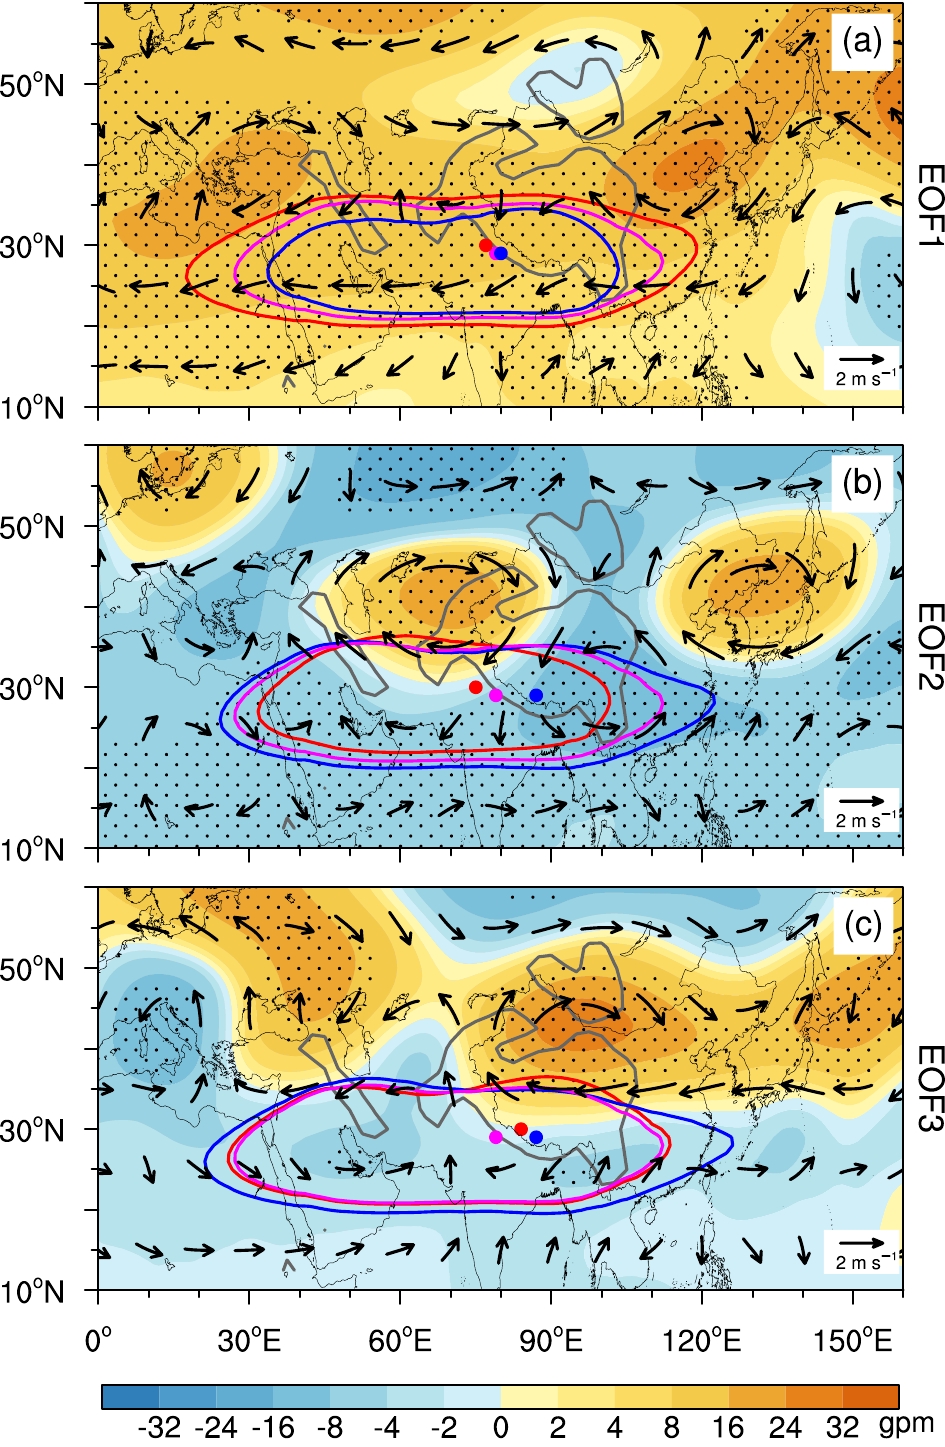
图 8 基于ERA-Interim资料水汽质量距平(a)第1、(b)第2、(c)第3特征向量EOF模态时间系数回归的7~8月200 hPa位势高度场(填色,单位:gpm)和水平风场(箭头,单位:m s−1)。打点区域表明位势高度回归值通过了90%置信水平检验的区域。实线和实心圆为12520 gpm位势高度等值线和南亚高压中心所在位置,粉色为气候平均,红色(蓝色)为正(负)位相显著异常年 Fig. 8 Regression analysis of 200-hPa potential height (shading, units: gpm) and horizontal wind (vectors, units: m s−1) on the time coefficients of the water vapor mass anomalies (a) first, (b) second, and (c) third EOF modes in July–August, based on ERA-Interim data. Black dots indicate the regressed potential height significant at the 90% confidence level. Solid lines denote the 12520 gpm potential height isolines and dots denote the location of the center of the South Asian High. Pink denotes climate mean and red (blue) denotes significantly abnormal positive (negative)-phase years |
首先,图7给出了7~8月水汽质量主导分布模态时间系数回归的OLR异常分布。整体异常型水汽质量整体偏多时对应青藏高原东南和孟加拉湾北部OLR为正异常,即对流活动异常偏弱,青藏高原其他地区OLR回归值主要为负值,并在青藏高原西南有显著的负值中心,代表这些地区的对流活动异常偏强(图7a)。总的来看,水汽质量整体偏多时青藏高原地区的对流活动偏强。
由图7b可见,东西偶极异常型水汽质量呈西多/东少分布时,青藏高原主体地区OLR异常与其西南侧呈反位相的分布。青藏高原主体OLR回归值为显著的正值,并在西北部和东部地区为正值中心,代表对流活动显著异常偏弱;而在青藏高原西南侧OLR回归值存在显著的负值中心,对流活动显著异常偏强。此外,孟加拉湾和中南半岛地区OLR回归值也为负值,表明那里的对流活动也异常偏强。而南北偶极异常型水汽质量呈北多/南少分布时,对应青藏高原主体西部(东部)OLR回归值为负值,对流活动异常偏强(偏弱);相反地,青藏高原以南印度和孟加拉湾西部地区OLR回归值为正值,即对流活动异常偏弱,中南半岛地区相反。
4.2 南亚高压年际异常首先来看相关分析的结果。表1给出了特征向量时间系数与南亚高压强度、中心所在经度和纬度的相关系数及其显著性。由表1可见,整体异常型模态时间系数与南亚高压强度有显著的正相关,相关系数达0.695,而与南亚高压中心所在经度和纬度分别呈负相关和正相关,但并不显著,表明水汽质量整体偏多时,南亚高压异常偏强。东西偶极异常型模态时间系数也与南亚高压强度、中心经度和纬度都有显著的相关关系,尤以南亚高压中心经度的相关最为显著,相关系数为−0.693,表明水汽质量呈西多/东少分布时对应着南亚高压中心为异常偏西,反之亦然。而南北偶极异常型模态时间系数只与南亚高压中心所在纬度有显著的正相关关系,但相关系数仅为0.289,指示水汽质量呈北多/南少分布时对应南亚高压中心异常偏北。
| 表 1 特征向量时间系数与200 hPa南亚高压强度、中心所在经度和纬度的相关系数及其显著性 Table 1 Correlations between eigenvector time coefficients and intensity, center longitudes, and center latitudes of the South Asian high at 200 hPa and their confidence levels |
为了进一步说明南亚高压强度和位置的异常。图8给出了7~8月200 hPa位势高度和风场对3个水汽质量主导分布型时间系数的回归。首先由图8a可见,与气候平均相比,整体异常型水汽质量整体偏多(偏少)年12520 gpm位势高度等值线包含的水平范围更大(小),但南亚高压的中心位置与气候平均接近。由回归的位势高度异常可见,青藏高原及周边地区位势高度异常偏高,证实了整体异常型主要对应着南亚高压强度的异常。
同样地,由图8b可见,东西偶极异常型水汽质量西多/东少年12520 gpm位势高度等值线包含的水平范围略偏小,南亚高压中心明显偏西,反之亦然。这和相关分析的结果一致,即时间系数与南亚高压中心所在经度的相关系数约是强度的两倍。由回归的结果,青藏高原西北部位势高度显著异常偏高,对应水平风场为异常的反气旋,而在青藏高原的中东部地区则相反。这与Wei et al.(2015)在分析南亚高压中心位置东西偏移时,得到的位势高度和水平风场的异常分布一致。因此,东西偶极异常型主要对应着南亚高压中心位置的东西偏移。
图8c表明,南北偶极异常型水汽质量北多/南少(北少/南多)年12520 gpm位势高度等值线所包含的面积偏小(偏大),南亚高压中心偏北(南)。回归的结果表明,水汽质量北多/南少时青藏高原北侧位势高度显著异常偏高,对应水平风场也为异常的反气旋;而青藏高原南侧位势高度异常偏低。这证实了上文相关分析的结果,南北偶极异常型主要与南亚高压中心所在纬度相关最好、最为显著。换言之,南北偶极异常型分布主要对应着南亚高压中心位置的南北偏移。
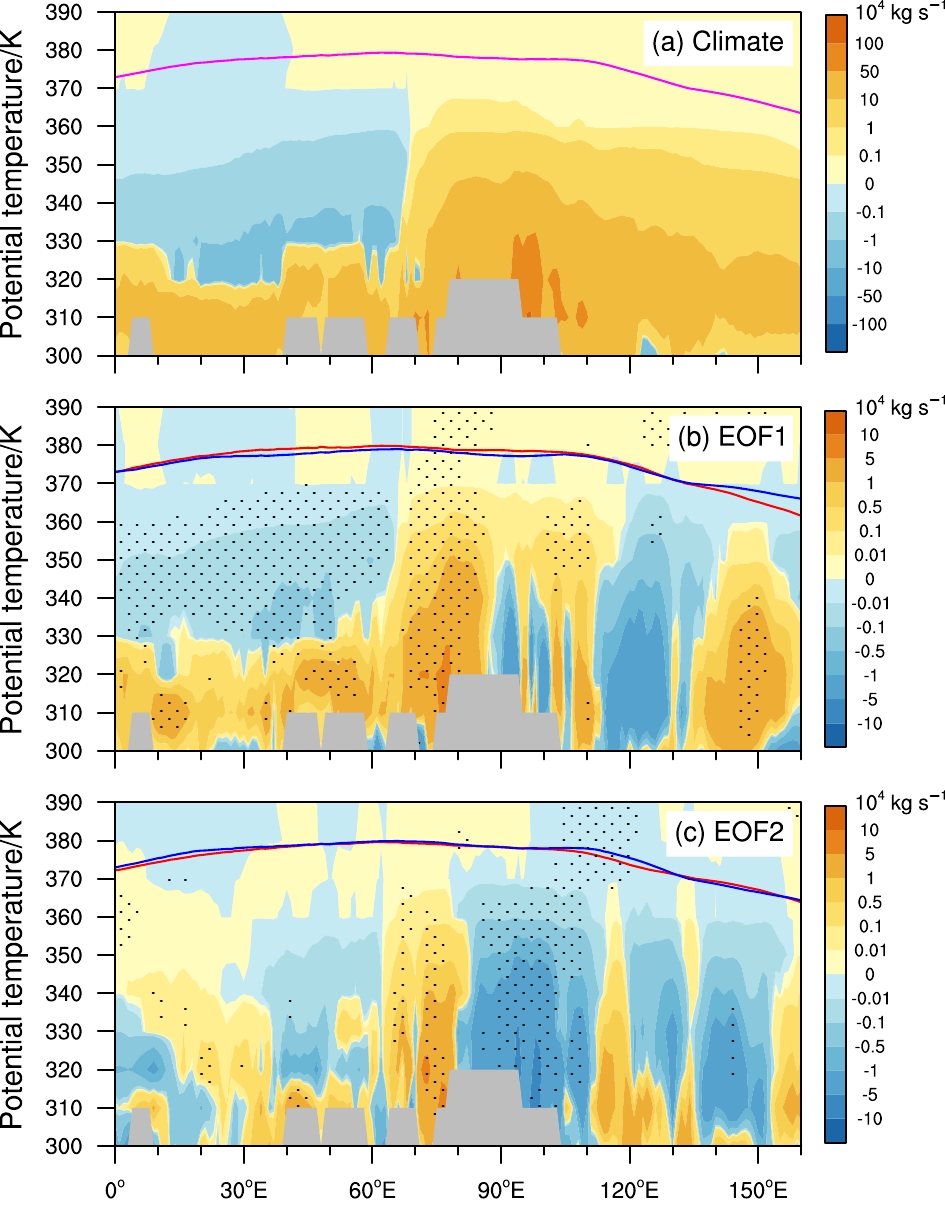
5 水汽质量绝热和非绝热输送异常变化 5.1 水汽质量非绝热输送3个水汽质量异常主导分布型所对应的上述环流异常所造成的水汽质量传输异常如何,是理解异常型形成原因的关键。由图9a可见,青藏高原纬度带(20°~35°N)7~8月平均而言,青藏高原地区上空为垂直向上的水汽质量非绝热输送,在青藏高原以西到伊朗高原地区上空平均为垂直向下的水汽质量非绝热输送。
|
图 9 基于ERA-Interim资料(a)气候平均以及水汽质量距平(b)第1、(c)第2特征向量EOF模态时间系数回归的7~8月非绝热水汽质量通量(填色,单位:104 kg s−1)沿青藏高原纬度带(20°~35°N)的等熵—经度剖面。打点区域表明非绝热水汽质量通量回归值通过了90%置信水平检验的区域;粉色实线为气候平均的对流层顶位置,红色(蓝色)实线为正(负)位相显著异常年的对流层顶位置 Fig. 9 Height–longitude cross sections of diabatic water-vapor-mass fluxes (shadings, units: 104 kg s−1) (a) climatically averaged and regressed of the water vapor mass anomalies (b) first and (c) second EOF modes time coefficients over the Tibetan Plateau latitude belt (20°–35°N) in July–August, based on ERA-Interim data. Black dots indicate the regressed diabatic water-vapor-mass fluxes at the 90% confidence level. Solid pink line denote the climatic tropopause location and solid red (blue) lines denote the tropopause location of significantly abnormal positive (negative)-phase years |
水汽质量整体偏多时,青藏高原地区上空非绝热水汽 质量通量回归值为正值,代表垂直向上的水汽质量非绝热输送异常偏强,并在青藏高原西部有正值中心;相反在青藏高原以西地区,330 K及以上层次非绝热水汽质量通量为异常负值,代表该地区垂直向下的水汽质量非绝热传输异常偏强(图9b)。
由图9c可见,水汽质量呈西多/东少分布时,青藏高原西部(中东部)地区上空非绝热水汽质量通量回归值为显著异常正(负)值,表明该地区垂直向上的水汽质量非绝热传输异常偏强(偏弱)。此时,伊朗高原地区非绝热水汽质量通量回归值为负值,即垂直向下的水汽质量非绝热输送异常偏强。
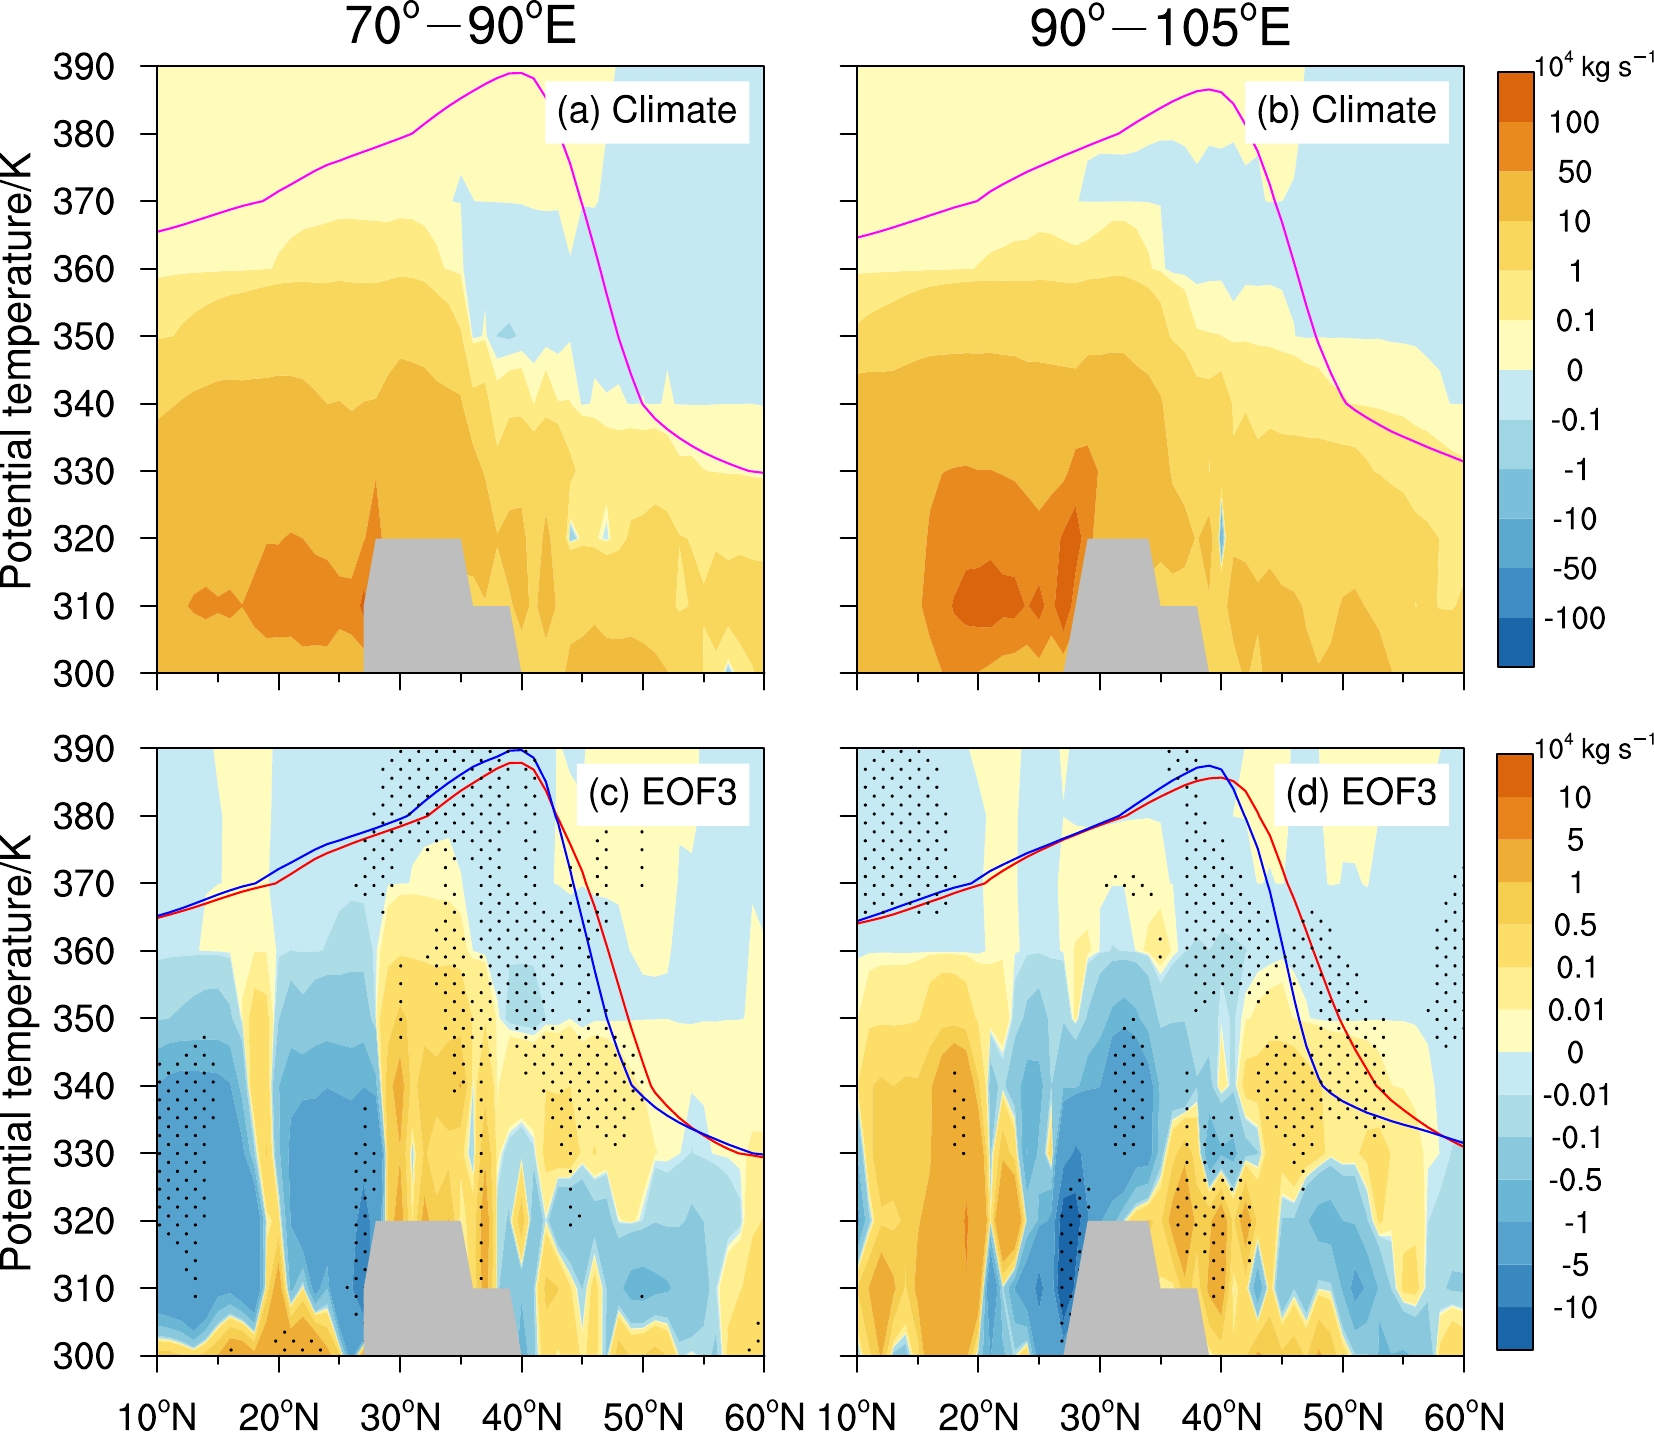
由上文的分析可知,南北偶极异常型对应青藏高原西部和东部的对流活动有相反的异常变化(图7c),因此将分两个经度带分析非绝热水汽质量通量的异常变化。由非绝热水汽质量通量的等熵—纬度剖面图(图10a、b)可见,青藏高原及其以南地区,在7~8月平均为垂直向上的水汽质量非绝热输送,而青藏高原以北地区在350 K层以上主要为垂直向下的水汽质量非绝热传输,在340 K层以下存在垂直向上的水汽质量非绝热传输。
|
图 10 基于ERA-Interim资料(a,b)气候平均以及(c,d)水汽质量距平第3特征向量EOF模态时间系数回归的7~8月非绝热水汽质量通量(填色,单位:104 kg s−1)沿青藏高原西部(70°~90°E;左列)和东部(90°~105°E;右列)经度带的等熵—纬度剖面。其中打点区域表明非绝热水汽质量通量回归值通过了90%置信水平检验的区域。粉色实线为气候平均的对流层顶位置,红色(蓝色)实线为正(负)位相显著异常年的对流层顶位置 Fig. 10 Height–latitude cross sections of diabatic water-vapor-mass fluxes (shadings, units: 104 kg s−1) (a, b) climatically averaged and regressed on (c, d) the water vapor mass anomalies third EOF mode time coefficients over the western (70°–90°E; left column) and eastern (90°–105°E; right column) Tibetan Plateau longitude belts in July–August, based on ERA-Interim data. Black dots indicate the regressed diabatic water-vapor-mass fluxes at the 90% confidence level. Solid pink lines denote the climatic tropopause location and solid red (blue) lines denote the tropopause location of significantly abnormal positive (negative)-phase years |
水汽质量呈北多/南少分布时,青藏高原西部经度带,在30°~40°N非绝热水汽质量通量在320~370 K层次为异常正值,垂直向上的水汽质量非绝热输送异常加强,30°N以南地区则相反(图10c)。在青藏高原东部经度带,青藏高原地区360 K以下层次非绝热水汽质量通量主要为负值,垂直向上的水汽质量非绝热输送异常偏弱,但是在25°N以南地区有相反的结果(图10d)。总之,水汽质量呈北多/南少分布时青藏高原西部(东部)垂直向上的水汽质量非绝热输送异常偏强(偏弱),其南侧地区则异常偏弱(偏强),水汽质量呈北少/南多分布时相反。
5.2 水汽质量绝热、非绝热输送的相对贡献水汽质量异常主导分布型在340~360 K层次最为显著,接下来将分析该层次的水汽质量绝热和非绝热传输对水汽质量异常型形成的作用。图11给出了340~360 K层次非绝热水汽质量通量散度、绝热水汽质量通量及其散度的气候平均值及合成与气候平均的差值场的水平分布。平均而言,青藏高原及以南地区在340~360 K层次有强的水汽质量非绝热辐合(负值),对水汽质量为正贡献,而青藏高原以西为水汽质量的非绝热辐散(正值),对水汽质量为负的贡献(图11a)。由图11b可知,绝热水汽质量通量散度有近乎相反的分布,只是散度值在青藏高原地区相对偏小,青藏高原以西地区相对偏大,但在青藏高原的北侧也为辐合,与非绝热水汽质量通量散度相同,不过散度值相对偏小。

|
图 11 基于ERA-Interim资料(a,b)气候平均以及水汽质量(c,d)整体偏多年、(e,f)整体偏少年合成与气候平均差值水平分布:7~8月340~360 K层次累加的非绝热水汽质量通量散度(左列,填色,单位:104 kg s−1)和绝热水汽质量通量矢量(箭头,单位:104 kg s−1)及其散度(右列填色,单位:104 kg s−1)。粉色实线为气候平均的对流层顶位置,红色(蓝色)实线为正(负)位相显著异常年的对流层顶位置。打点区域表明水汽质量通量散度差值通过了90%置信水平检验的区域 Fig. 11 Horizontal distributions of the divergence of diabatic water-vapor-mass fluxes (left column, shadings, units: 104 kg s−1) and the vectors of adiabatic water-vapor-mass fluxes (vectors, units: 104 kg s−1) and their divergences (right column, shadings, units: 104 kg s−1) accumulated from the 340–360 K layers averaged in July–August, based on ERA-Interim data: (a–b) Climatic mean, water vapor mass (c–d) whole region more years minus the climate mean, and (e–f) whole region less years minus the climate mean. Solid pink lines denote the climatic tropopause locations and solid red (blue) lines denote the tropopause locations of significantly abnormal positive (negative)-phase years. Black dots indicate significant differences in the divergence of water-vapor-mass fluxes at the 90% confidence level |
由图11c可见,水汽质量整体偏多年,青藏高原及其西侧地区非绝热水汽质量通量散度异常和绝热水汽质量通量散度异常的分布相反。青藏高原地区非绝热水汽质量通量散度主要为异常的辐合,对水汽质量偏多有正贡献,绝热水汽质量通量呈异常的反气旋型,并在青藏高原地区为异常的水汽质量辐散,对水汽质量有负贡献,但绝热散度异常值小于非绝热散度异常值。而青藏高原以西为异常的水汽质量非绝热辐散和水汽质量绝热辐合,且后者的量值大于前者,对水汽质量主要是水汽质量的绝热输送异常决定了水汽质量的偏多(图11d)。水汽质量整体偏少年,有类似的结果,即青藏高原地区的水汽质量异常主要由水汽质量的非绝热传输异常所决定,水汽质量的绝热传输异常起抵消作用;在青藏高原以西地区不同,水汽质量的异常主要由水汽质量的绝热传输异常所决定(图11e、f)。
由图12a可见,水汽质量西多/东少年,青藏高原西部(70°~80°E)地区非绝热水汽质量通量散度为异常辐合,中东部(80°~105°E)为异常辐散,对水汽质量的西多/东少有正贡献;此时,绝热水汽质量通量在青藏高原西部为异常辐散,中东部为异常辐合,且绝热散度异常值小于非绝散度异常值,对水汽质量的西多/东少起抵消作用(图12b)。在青藏高原以西到伊朗高原地区非绝热水汽质量通量散度为异常的辐散,而绝热水汽质量通量呈现异常向西的水汽质量绝热输送和异常的水汽质量绝热辐合,且量值大于非绝热散度异常值,对水汽质量的偏多起主要作用。在水汽质量西少/东多年有类似的结果,但符号相反(图12c、d)。总之,水汽质量非绝热输送在青藏高原地区为影响水汽质量分布异常的主要过程,在青藏高原以西到伊朗高原地区则是水汽质量的绝热输送异常起了重要作用。

|
图 12 同图11c–f,但(a–b)为水汽质量西多/东少年,(c–d)为水汽质量西少/东多年 Fig. 12 Same as Fig.11c–f, but for water vapor mass (a–b) west more/east less years and (c–d) west less/east more years |
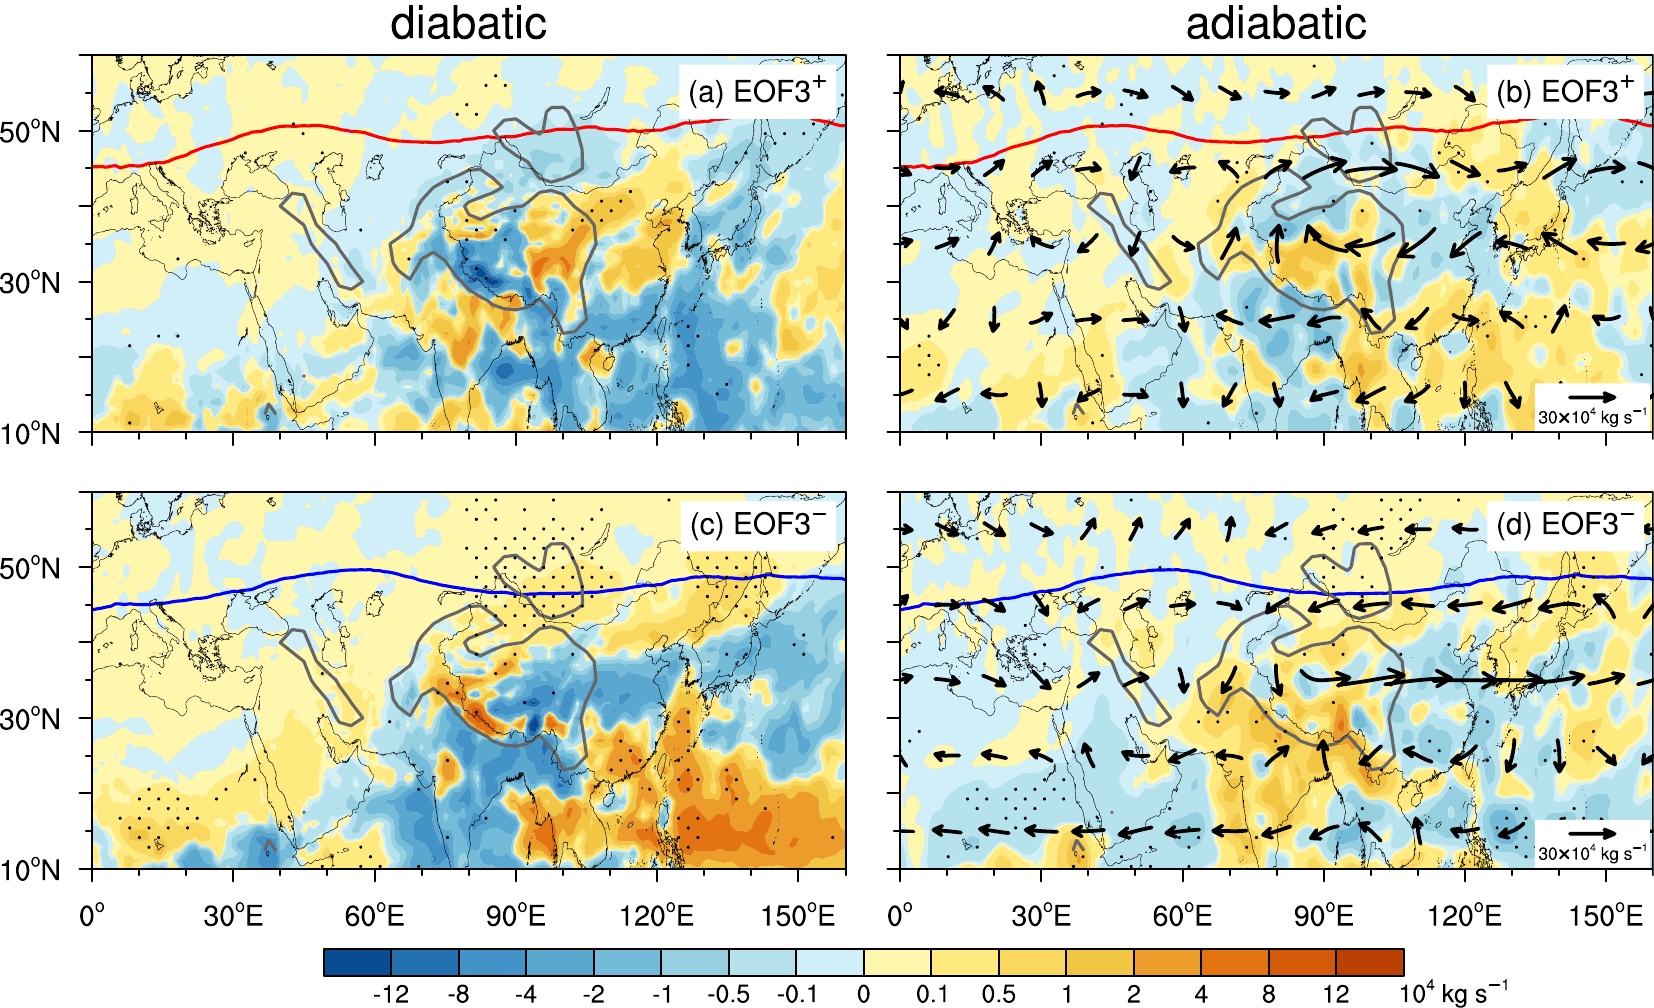
由图13可见,在青藏高原北侧(35°~50°N)非绝热和绝热水汽质量通量散度异常呈同位相变化。具体地,水汽质量北多/南少年青藏高原北侧以及高原中西部地区非绝热水汽质量通量散度都为异常的辐合(图13a),这主要与低层垂直向上的水汽质量非绝热输送加强有关(见图10c、d);绝热水汽质量通量为异常的反气旋,呈现异常向北的水汽质量输送和异常的水汽质量辐合(图13b),与水汽质量非绝热散度共同对水汽质量的偏多有正的贡献,但水汽质量非绝热散度异常值的量级略大。而在青藏高原中西部偏南侧(20°~30°N),非绝热水汽质量通量散度为异常的辐散,对水汽质量的异常偏少起主要作用。此时绝热水汽质量通量散度为异常的辐合,但量值小于非绝热散度异常值。由图13c、d不难看出,水汽质量北少/南多年类似,只是符号相反。总之,水汽质量非绝热输送在青藏高原南侧地区为影响水汽质量分布异常的主要过程,在青藏高原北侧地区则是水汽质量的绝热和非绝热输送异常共同起作用。
|
图 13 同图11c~f,但(a–b)为水汽质量北多/南少年,(c–d)为水气质量北少/南多年 Fig. 13 Same as Figs. 11c–f, but for water vapor mass (a–b) north more/south less years and (c–d) north less/south more years |
本文首先通过EOF分析,揭示了青藏高原及周边地区7~8月330~360 K层次水汽质量的主导分布型,发现在年际时间尺度上,上对流层水汽质量存在整体异常型、东西偶极异常型和南北偶极异常型分布,进而分析不同分布型下青藏高原地区对流活动及南亚高压的异常变化,并进一步分析了上对流层水汽质量的绝热和非绝热传输对水汽质量分布的贡献,主要结论如下:
青藏高原上空水汽质量整体偏多时,青藏高原地区对流和垂直向上的水汽质量非绝热传输异常偏强,上对流层有异常偏强的水汽质量非绝热辐合导致水汽质量偏多;对应南亚高压偏强,青藏高原以西上对流层则主要由异常偏强的水汽质量绝热辐合导致水汽质量偏多。在水汽质量整体偏少时则相反。
青藏高原上空水汽质量西多/东少时,青藏高原西部(中东部)对流和垂直向上的水汽质量非绝热传输偏强(弱),上对流层有异常偏强的水汽质量非绝热辐合(辐散)导致水汽质量偏多(少);同时对应南亚高压偏西,青藏高原以西到伊朗高原地区的上对流层有异常自东向西的水汽质量绝热输送和水汽质量绝热辐合导致水汽质量偏多。水汽质量西少/东多时相反。
青藏高原上空水汽质量北多/南少时,对应南亚高压偏北,青藏高原北部上对流层有异常自南向北的水汽质量绝热输送造成的水汽质量辐合,与该地区低层异常偏强的垂直向上的水汽质量非绝热输送共同导致水汽质量偏多;青藏高原南侧上对流层则是异常偏弱的水汽质量非绝热辐合导致水汽质量偏少。水汽质量北少/南多时相反。
本文得到的结果是分析夏季青藏高原及周边地区水汽质量向平流层的绝热和非绝热传输年际异常的基础。后续研究将进一步给出对应水汽质量异常主导分布型,青藏高原及周边地区水汽质量向平流层的绝热和非绝热传输的主要区域和强度的变化。
致谢 感谢ECMWF提供的ERA-Interim再分析资料。感谢NOAA/CIRES提供的SWOOSH资料。
毕云, 陈月娟, 周任君, 等. 2008. 青藏高原上空H2O和CH4的分布和变化趋势分析
[J]. 高原气象, 27(2): 249-258. Bi Yun, Chen Yuejuan, Zhou Renjun, et al. 2008. Study on H2O and CH4 distributions and variations over Qinghai−Xizang Plateau using HALOE data
[J]. Plateau Meteor. (in Chinese) (in Chinese), 27(2): 249-258.
|
卞建春, 严仁嫦, 陈洪滨. 2011. 亚洲夏季风是低层污染物进入平流层的重要途径[J]. 大气科学, 35(5): 897-902. Bian Jianchun, Yan Renchang, Chen Hongbin. 2011. Tropospheric pollutant transport to the stratosphere by Asian summer monsoon[J]. Chinese Journal of Atmospheric Sciences (in Chinese) (in Chinese), 35(5): 897-902. DOI:10.3878/j.issn.1006-9895.2011.05.09
|
Bian J C, Pan L L, Paulik L, et al. 2012. In situ water vapor and ozone measurements in Lhasa and Kunming during the Asian summer monsoon[J]. Geophys. Res. Lett., 39(19): L19808. DOI:10.1029/2012gl052996
|
Birner T, Charlesworth E J. 2017. On the relative importance of radiative and dynamical heating for tropical tropopause temperatures[J]. J. Geophys. Res. Atmos., 122(13): 6782-6797. DOI:10.1002/2016jd026445
|
陈斌, 徐祥德, 施晓晖. 2009. 2005年夏季亚洲季风区下平流层水汽的对流源区[J]. 自然科学进展, 19(10): 1094-1099. Chen Bin, Xu Xiangde, Shi Xiaohui. 2009. The dominant sources of water vapor in the low stratosphere over Asian monsoon region during the boreal summer in 2005[J]. Progress in Natural Science (in Chinese) (in Chinese), 19(10): 1094-1099. DOI:10.3321/j.issn:1002-008X.2009.10.011
|
陈斌, 徐祥德, 施晓晖. 2011. 南亚高压对亚洲季风区夏季对流层上层水汽异常分布的动力效应[J]. 气象学报, 69(3): 464-471. Chen Bin, Xu Xiangde, Shi Xiaohui. 2011. A study of the dynamic effect of the South Asian high on the upper troposphere water vapor abnormal distribution over the Asian monsoon region in boreal summer[J]. Acta Meteor. Sin. (in Chinese) (in Chinese), 69(3): 464-471.
|
陈斌, 徐祥德, 杨帅, 等. 2012. 夏季青藏高原地区近地层水汽进入平流层的特征分析[J]. 地球物理学报, 55(2): 406-414. Chen Bin, Xu Xiangde, Yang Shuai, et al. 2012. On the characteristics of water vapor transport from atmosphere boundary layer to stratosphere over Tibetan Plateau regions in summer[J]. Chin. J. Geophys. (in Chinese) (in Chinese), 55(2): 406-414.
|
Davis S M, Rosenlof K H, Hassler B, et al. 2016. The Stratospheric Water and Ozone Satellite Homogenized (SWOOSH) database: A long-term database for climate studies[J]. Earth Syst. Sci. Data, 8(2): 461-490. DOI:10.5194/essd-8-461-2016
|
Davis S M, Hegglin M I, Fujiwara M, et al. 2017. Assessment of upper tropospheric and stratospheric water vapor and ozone in reanalyses as part of S-RIP[J]. Atmos. Chem. Phys., 17(20): 12743-12778. DOI:10.5194/acp-17-12743-2017
|
Dethof A, O'Neill A, Slingo J M, et al. 1999. A mechanism for moistening the lower stratosphere involving the Asian summer monsoon[J]. Quart. J. Roy. Meteor. Soc., 125(556): 1079-1106. DOI:10.1002/qj.1999.49712555602
|
Fu R, Hu Y, Wright J S, et al. 2006. Short circuit of water vapor and polluted air to the global stratosphere by convective transport over the Tibetan Plateau[J]. Proc. Natl. Acad. Sci. USA, 103(15): 5664-5669. DOI:10.1073/pnas.0601584103
|
Garny H, Randel W J. 2013. Dynamic variability of the Asian monsoon anticyclone observed in potential vorticity and correlations with tracer distributions[J]. J. Geophys. Res. Atmos., 118(24): 13421-13433. DOI:10.1002/2013jd020908
|
Gettelman A, Kinnison D E, Dunkerton T J, et al. 2004. Impact of monsoon circulations on the upper troposphere and lower stratosphere[J]. J. Geophys. Res., 109: D22101. DOI:10.1029/2004jd004878
|
黄莹, 郭栋, 周顺武, 等. 2017. 夏季南亚高压与邻近上对流层下平流层区水汽变化的联系[J]. 气象学报, 75(6): 934-942. Huang Ying, Guo Dong, Zhou Shunwu, et al. 2017. The relationship between South Asia high and water vapor variation in the upper troposphere and lower stratosphere in summer[J]. Acta Meteor. Sin. (in Chinese) (in Chinese), 75(6): 934-942. DOI:10.11676/qxxb2017.065
|
James R, Bonazzola M, Legras B, et al. 2008. Water vapor transport and dehydration above convective outflow during Asian monsoon[J]. Geophys. Res. Lett., 35(20): L20810. DOI:10.1029/2008gl035441
|
Jiang J H, Su H, Zhai C X, et al. 2015. An assessment of upper troposphere and lower stratosphere water vapor in MERRA, MERRA2, and ECMWF reanalyses using Aura MLS observations[J]. J. Geophys. Res. Atmos., 120(22): 11468-11485. DOI:10.1002/2015jd023752
|
Kunze M, Braesicke P, Langematz U, et al. 2010. Influences of the Indian summer monsoon on water vapor and ozone concentrations in the UTLS as simulated by chemistry-climate models[J]. J. Climate, 23(13): 3525-3544. DOI:10.1175/2010jcli3280.1
|
Kunze M, Braesicke P, Langematz U, et al. 2016. Interannual variability of the boreal summer tropical UTLS in observations and CCMVal-2 simulations[J]. Atmos. Chem. Phys., 16(13): 8695-8714. DOI:10.5194/acp-16-8695-2016
|
吕达仁, 陈泽宇, 卞建春, 等. 2008. 平流层—对流层相互作用的多尺度过程特征及其与天气气候关系: 研究进展[J]. 大气科学, 32(4): 782-793. Lü Daren, Chen Zeyu, Bian Jianchun, et al. 2008. Advances in researches on the characteristics of multi-scale processes of interactions between the stratosphere and the troposphere and its relations with weather and climate[J]. Chinese Journal of Atmospheric Sciences (in Chinese) (in Chinese), 32(4): 782-793. DOI:10.3878/j.issn.1006-9895.2008.04.07
|
Lelieveld J, Bourtsoukidis E, Brühl C, et al. 2018. The South Asian monsoon: Pollution pump and purifier[J]. Science, 361(6399): 270-273. DOI:10.1126/science.aar2501
|
Park M, Randel W J, Gettelman A, et al. 2007. Transport above the Asian summer monsoon anticyclone inferred from Aura Microwave Limb Sounder tracers[J]. J. Geophys. Res., 112(D16): D16309. DOI:10.1029/2006jd008294
|
Park M, Randel W J, Emmons L K, et al. 2008. Chemical isolation in the Asian monsoon anticyclone observed in Atmospheric Chemistry Experiment (ACE-FTS) data[J]. Atmos. Chem. Phys., 8(3): 757-764. DOI:10.5194/acp-8-757-2008
|
Ploeger F, Günther G, Konopka P, et al. 2013. Horizontal water vapor transport in the lower stratosphere from subtropics to high latitudes during boreal summer[J]. J. Geophys. Res. Atmos., 118(14): 8111-8127. DOI:10.1002/jgrd.50636
|
Randel W J, Park M. 2006. Deep convective influence on the Asian summer monsoon anticyclone and associated tracer variability observed with Atmospheric Infrared Sounder (AIRS)[J]. J. Geophys. Res., 111(D12): D12314. DOI:10.1029/2005jd006490
|
Randel W J, Park M, Emmons L, et al. 2010. Asian monsoon transport of pollution to the stratosphere[J]. Science, 328(5978): 611-613. DOI:10.1126/science.1182274
|
Randel W J, Zhang K, Fu R. 2015. What controls stratospheric water vapor in the NH summer monsoon regions?[J]. J. Geophys. Res. Atmos., 120(15): 7988-8001. DOI:10.1002/2015jd023622
|
Rolf C, Vogel B, Hoor P, et al. 2018. Water vapor increase in the lower stratosphere of the Northern Hemisphere due to the Asian monsoon anticyclone observed during the TACTS/ESMVal campaigns[J]. Atmos. Chem. Phys., 18(4): 2973-2983. DOI:10.5194/acp-18-2973-2018
|
Santee M L, Manney G L, Livesey N J, et al. 2017. A comprehensive overview of the climatological composition of the Asian summer monsoon anticyclone based on 10 years of Aura Microwave Limb Sounder measurements[J]. J. Geophys. Res. Atmos., 122(10): 5491-5514. DOI:10.1002/2016jd026408
|
唐南军, 任荣彩, 吴国雄. 2020. 青藏高原及周边UTLS水汽时空特征的多源资料对比 [J]. 大气科学学报, 待刊. Tang N J, Ren R C, Wu G X. 2020. Comparison of upper troposphere and lower stratosphere water vapor spatial and temporal distribution over Tibetan Plateau in reanalysis data and MLS observations [J]. Transactions of Atmospheric Sciences (in Chinese), in press, doi: 10.13878/j.cnki.dakxxb.20170706001.
|
唐南军, 任荣彩, 邹晓蕾, 等. 2019. 夏季青藏高原地区水汽向平流层的等熵绝热和非绝热传输的气候学特征及其与落基山地区的对比[J]. 大气科学, 43(1): 183-201. Tang Nanjun, Ren Rongcai, Zou Xiaolei, et al. 2019. Characteristic of adiabatic and diabatic water vapor transport from the troposphere to the stratosphere over the Tibetan Plateau and its comparison with the Rocky Mountains in the summer[J]. Chinese Journal of Atmospheric Sciences (in Chinese) (in Chinese), 43(1): 183-201. DOI:10.3878/j.issn.1006-9895.1804.17255
|
田红瑛, 田文寿, 雒佳丽, 等. 2014. 青藏高原地区上对流层—下平流层区域水汽分布和变化特征[J]. 高原气象, 33(1): 1-13. Tian Hongying, Tian Wenshou, Luo Jiali, et al. 2014. Characteristics of water vapor distribution and variation in upper troposphere and lower stratosphere over Qinghai−Xizang Plateau[J]. Plateau Meteor. (in Chinese) (in Chinese), 33(1): 1-13. DOI:10.7522/j.issn.1000-0534.2013.00074
|
屠厚旺, 田红瑛, 梅成红, 等. 2018. 南亚高压的东西偏向对亚洲季风区对流层顶附近水汽分布的影响[J]. 气候与环境研究, 23(3): 341-354. Tu Houwang, Tian Hongying, Mei Chenghong, et al. 2018. Impact of the east-west phase of South Asia high on water vapor distribution near tropopause over the Asian monsoon region[J]. Climatic and Environmental Research (in Chinese) (in Chinese), 23(3): 341-354. DOI:10.3878/j.issn.1006-9585.2017.17048
|
Uma K N, Das S K, Das S S. 2014. A climatological perspective of water vapor at the UTLS region over different global monsoon regions: Observations inferred from the Aura-MLS and reanalysis data[J]. Clim. Dyn., 43(1−2): 407-420. DOI:10.1007/s00382-014-2085-9
|
Wang T, Dessler A E, Schoeberl M R, et al. 2015. The impact of temperature vertical structure on trajectory modeling of stratospheric water vapor[J]. Atmos. Chem. Phys., 15(6): 3517-3526. DOI:10.5194/acp-15-3517-2015
|
魏凤英. 2007. 现代气候统计诊断与预测技术 (第2版) [M], 北京: 气象出版社, 105–111. Wei Fengying. 2007. Modern Climatic Statistical Diagnosis and Forecasting Technology (second edition), Beijing: China Meteorological Press: 105−111
|
Wei Wei, Zhang Renhe, Wen Min, et al. 2015. Interannual variation of the South Asian high and its relation with Indian and East Asian summer monsoon rainfall[J]. J. Climate, 28(7): 2623-2634. DOI:10.1175/jcli-d-14-00454.1
|
Wright J S, Fu R, Fueglistaler S, et al. 2011. The influence of summertime convection over Southeast Asia on water vapor in the tropical stratosphere[J]. J. Geophys. Res., 116(D12): D12302. DOI:10.1029/2010jd015416
|
吴国雄, 刘屹岷, 何编, 等. 2018. 青藏高原感热气泵影响亚洲夏季风的机制[J]. 大气科学, 42(3): 488-504. Wu Guoxiong, Liu Yimin, He Bian, et al. 2018. Review of the impact of the Tibetan Plateau sensible heat driven air-pump on the Asian summer monsoon[J]. Chinese Journal of Atmospheric Sciences (in Chinese) (in Chinese), 42(3): 488-504. DOI:10.3878/j.issn.1006-9895.1801.17279
|
Wu G X, He B, Liu Y M, et al. 2015. Location and variation of the summertime upper-troposphere temperature maximum over South Asia[J]. Clim. Dyn., 45(9-10): 2757-2774. DOI:10.1007/s00382-015-2506-4
|
Xu X D, Lu C G, Shi X H, et al. 2008. World water tower: An atmospheric perspective[J]. Geophys. Res. Lett., 35(20): L20815. DOI:10.1029/2008gl035867
|
Yan R C, Bian J C, Fan Q J. 2011. The impact of the South Asia high bimodality on the chemical composition of the upper troposphere and lower stratosphere[J]. Atmos. Ocean. Sci. Lett., 4(4): 229-234. DOI:10.1080/16742834.2011.11446934
|
Yu P F, Rosenlof K H, Liu S, et al. 2017. Efficient transport of tropospheric aerosol into the stratosphere via the Asian summer monsoon anticyclone[J]. Proc. Natl. Acad. Sci. USA, 114(27): 6972-6977. DOI:10.1073/pnas.1701170114
|
Yu Y Y, Ren R C, Hu J G, et al. 2014. A mass budget analysis on the interannual variability of the polar surface pressure in the winter season[J]. J. Atmos. Sci., 71(9): 3539-3553. DOI:10.1175/jas-d-13-0365.1
|
Yu Y Y, Cai M, Ren R C. 2018. A stochastic model with a low-frequency amplification feedback for the stratospheric northern annular mode[J]. Clim. Dyn., 50(9−10): 3757-3773. DOI:10.1007/s00382-017-3843-2
|
占瑞芬, 李建平. 2008a. 青藏高原地区大气红外探测器(AIRS)资料质量检验及揭示的上对流层水汽特征[J]. 大气科学, 32(2): 242-260. Zhan Ruifen, Li Jianping. 2008a. Validation and characteristics of upper tropospheric water vapor over the Tibetan Plateau from AIRS satellite retrieval[J]. Chinese Journal of Atmospheric Sciences (in Chinese) (in Chinese), 32(2): 242-260. DOI:10.3878/j.issn.1006-9895.2008.02.05
|
占瑞芬, 李建平. 2008b. 青藏高原和热带西北太平洋大气热源在亚洲地区夏季平流层—对流层水汽交换的年代际变化中的作用[J]. 中国科学D辑: 地球科学, 51(8): 1179-1193. Zhan Ruifen, Li Jianping. 2008b. Influence of atmospheric heat sources over the Tibetan Plateau and the tropical western North Pacific on the inter-decadal variations of the stratosphere−troposphere exchange of water vapor[J]. Science in China Series D: Earth Sciences, 51(8): 1179-1193. DOI:10.1007/s11430-008-0082-8
|
占瑞芬, 李建平. 2012. 亚洲夏季平流层—对流层水汽交换年际变化与亚洲夏季风的联系[J]. 地球物理学报, 55(10): 3181-3193. Zhan Ruifen, Li Jianping. 2012. Relationship of interannual variations of the stratosphere−troposphere exchange of water vapor with the Asian summer monsoon[J]. Chin. J. Geophys. (in Chinese) (in Chinese), 55(10): 3181-3193. DOI:10.6038/j.issn.0001-5733.2012.10.001
|
张琼, 钱永甫, 张学洪. 2000. 南亚高压的年际和年代际变化[J]. 大气科学, 24(1): 67-78. Zhang Qiong, Qian Yongfu, Zhang Xuehong. 2000. Interannual and interdecadal variations of the South Asia high[J]. Chinese Journal of Atmospheric Sciences (in Chinese) (in Chinese), 24(1): 67-78. DOI:10.3878/j.issn.1006-9895.2000.01.07
|
Zhang K, Fu R, Wang T, et al. 2016. Impact of geographic variations of the convective and dehydration center on stratospheric water vapor over the Asian monsoon region[J]. Atmos. Chem. Phys., 16(12): 7825-7835. DOI:10.5194/acp-16-7825-2016
|
 2020, Vol. 44


