 2012, Vol. 17


年代际尺度气候变率是季节-年际气候预测的重要背景场。Meehl et al.(2009)指出,考虑不同的时间尺度,天气预报(forecast)和短期气候预测(如ENSO预报,王会军等,2010)可以视为一个“初值问题”;而多年代际至世纪尺度的气候预估(projection)则可视为“边界条件”问题,受外强迫如温室气体的影响较大,而年代际气候变化介于这二者之间,它不仅要考虑温室气体等外部边界强迫,也要考虑当前气候的初始状态如海洋热含量、陆地雪盖和土壤湿度等(Keith et al., 2009; Meehl et al., 2009)。年代际气候变化也是当前气候变化研究的一个新方向,已引起越来越多的关注(Doherty et al., 2009)。如10~30 a尺度的年代际气候预测是目前正在进行的第5次耦合模式比较计划(The fifth phase of the Coupled Model Intercomparison Project,CMIP5)的一个重要的内容(Taylor et al., 2009)。
目前,国际上已开始利用海气耦合模式来进行年代际(10 a尺度)的动力预测,如Keenlyside et al.(2008)利用ECHAM5/MPI-OM耦合模式,对1955~2005年的北大西洋邻近区域的表面温度以及大西洋经向翻转流(Meridional Overturning Circulation,MOC)进行了多年代际回报检验和预测;Smith et al.(2007)利用基于HadCM3模式的年代际气候预测系统(Decadal climate Prediction System,DePreSys),对全球表面温度的年代际变化进行了模拟;Pohlmann et al.(2009)利用ECHAM5/MPI-OM耦合模式考察了上层海洋分析资料对于北大西洋年代际气候预测的影响; Mochizuki et al.(2010)则指出上层海洋观测资料的初始化能显著提高对太平洋年代际振荡(Pacific Decadal Oscillation,PDO)的模拟能力。同时对于耦合模式对中国区域温度、降水年代际变化的模拟能力的评估也已开始有了一些工作,但主要基于参与第三次模式比较计划(phase 3 of the Coupled Model Inter-comparison Project,CMIP3)的一些模式(Zhou and Yu, 2006;杨军丽等,2007;孙颖和丁一汇,2008)。Meehl et al.(2009)对年代际气候预测的一些科学问题进行了回顾。欧洲联盟ENSEMBLES计划(van der Linden and Mitchell, 2009)利用多个全球耦合模式进行了季节-年际-年代际-世纪尺度预测。
本文利用上述ENSEMBLES计划的4个海气耦合模式对全球1960~2005年的多个年代际集合回报实验结果,分析这些耦合模式对中国区域年代际气候变化的预测潜力,并通过与CMIP3计划22个多模式集成结果进行对比,考察加入观测资料的初始化对年代际预报结果的影响,从而为将来利用耦合模式进行中国区域的年代际气候预测提供理论依据。
2 模式试验介绍
本文采用的参与ENSEMBLES年代际气候预测的耦合模式主要有:欧洲中期预报中心(ECMWF)的IFS/HOPE模式,英国气象局(UKMO)的HadGEM2-AO模式,法国气象局(MF)的ARPEGE/OPA,以及德国基尔大学莱布尼兹海洋科学研究所(IFM)采用的ECHAM5/MPI-OM(基本信息如表 1所示)。以上模式分别采用1960年、1965年、 1970年、1975年、1980年、1985年、1990年、1995年、2000年、2005年的11月的气候系统观测资料(如海洋、海冰状况)来初始化(同化),进行为期10 a(120个月)的预测回报试验,以预测此后10年的气候,如初始于2005年的试验预测期是2005~2015年。此外,所有的模式都包括了外部辐射强迫过程,即采用观测温室气体和硫酸盐气溶胶。上述4个模式每个都包含3个不同初始状态的运行(realization),本文取这3个运行的集合平均。此外,因本文关注的是年代际预测,故将预测的1960~2005年每个10年取其平均,并将1960~1970年平均值记为1960s,2005~2015年平均值记为2005s,其他类同,一共得到10个年代际气候变化的序列。有关模式试验设计的更多信息请参见van der Linden and Mitchell(2009)和Weisheimer et al.(2009)。
| 表 1 用于年代际气候预测的4个模式的基本信息 Table 1 Characteristics of the four climate models used for decadal climate prediction |
此外,本文还利用了22个CMIP3/IPCC AR4(Meehl et al., 2007)模式20世纪(20C3M)的结果,并取多模式集合,记为CMIP3-MME;注意到CMIP3/IPCC AR4模式初始于前工业化阶段(大部分模式在1860年左右,Meehl et al., 2007),故在1961~2000年并没有如ENSEMBLES项目的4个模式那样融入海温、海冰等观测资料进行同化处理,故比较这二者的结果可以看出初始化对年代际预报结果的影响。很多研究表明模式集合的性能较大部分单个模式性能有所提高,故本文对参与ENSEMBLES计划的4个模式——IFS/HOPE、HadGEM2-AO、ARPEGE/OPA和ECHAM5/MPI-OM取其集合平均,记为ENSEMBLES-MME。以下的分析主要评估ENSEMBLES-MME和CMIP3-MME的模拟能力。
用于评估模式所采用的观测温度和降水资料分别来自于Xu et al.(2009)和Xie et al.(2007)和发展的中国(东亚)区域格点数据集,其分辨率为0.5°(纬度)×0.5°(经度)。为便于比较,所有模式资料都采用双线性插值插值到1°(纬度)×1°(经度)的格点上。
3 年代际气候变化模拟能力的评估 3.1 气候场
模式能够对某一变量进行年代际变化预测的首要条件应该是能够正确地模拟气候多年平均场,因此首先对模式模拟的气候平均场进行检验。图 1给出了中国区域1961~2000年表面温度的观测场(Xu et al., 2009)以及ENSEMBLES-MME和CMIP3-MME这2组模式的差值场,其中ENSEMBLES-MME用1960s、1970s、1980s、1990s 4个年代的平均代表 1961~2000年气候场。ENSEMBLES-MME和CMIP3-MME能模拟出与观测(图 1a)较一致的空间分布状况,与观测温度场的空间相关系数皆达到0.95。但2组模式都存在不同程度的冷偏差,大值区主要位于青藏高原及其东部以及南疆沙漠,CMIP3-MME的偏差最高达到-6 °C,而东部季风区(110°E以东)的偏差相对较小。相对于CMIP3模式集合,年代际预测模式ENSEMBLES-MME对冷偏差有显著的改进,如青藏高原及中国中东部地区,冷偏差减少约2 °C(图 1b和1c)。中国区域平均的总体偏差CMIP3-MME为-1.56 °C,而ENSEMBLES-MME为-0.20 °C。
 |
图 1 中国区域1961~2000年平均温度场(单位: °C)的分布:(a)观测场;(b)CMIP3-MME差值场(模拟减观测);(c)ENSEMBLES-MME差值场(模拟减观测)Fig. 1 Spatial patterns of annual-mean temperature field(°C)for the period 1961-2000 over China:(a)Observation;(b)tempe-rature bias of CMIP3-MME(modeled minus observed);(c)temperature bias of ENSEMBLES-MME(modeled minus observed) |
对于降水,ENSEMBLES-MME和CMIP3-MME都能模拟出中国区域降水由东南沿海向西北内陆递减的空间分布型(图 2a),与观测场的空间相关系数分别为0.83和0.80。由2组模式的偏差场(图 2b和2c)可以发现,2组模式具有较一致的误差分布形式,除华南沿海外,模式模拟的降水普遍偏多,高值中心位于青藏高原及其东麓。该虚假降水中心的存在,有研究表明是由于模式分辨率不足引起的(高学杰等,2006)。而在东部季风区的模拟偏差相对较小。较之CMIP3-MME,ENSEMBLES-MME对降水气候场模拟的改善主要位于华南沿海和西北地区南部,如ENSEMBLES-MME对华南沿海的降水尽管仍然偏低,但范围和幅度显著小于CMIP3-MME;而在南疆地区,CMIP3-MME存在很大的湿偏差,偏差百分率达到950%,但ENSEMBLES-MME对该区降水的模拟与观测较为一致(图 2b和2c)。中国区域平均的降水偏差百分率,CMIP3-MME为125%,ENSEMBLES-MME略有改善,其偏差百分率为105%。
 |
图 2 同图 1,但为降水场(单位: mm·d-1)Fig. 2 Same as Fig. 1,but for precipitation field(mm·d-1) |
对于各单个模式,表 2给出了各模式模拟的1961~2000年气候场与观测场的空间相关系数及区域总体偏差。可以发现,各模式对温度和降水的空间分布模拟都比较好,且前者好于后者,但都存在系统偏差,如温度除IFS/HOPE和ECHAM5/MPI-OM模式分别模拟偏高1.8 °C和0.64 °C外,其他模式都存在冷偏差;而对降水,所有模式降水都偏多,其幅度在70%~160%。同时可以看到,多模式集合ENSEMBLES-MME依然具有较为稳健的模拟性能,且ENSEMBLES-MME的总体模拟性能优于CMIP3-MME。
| 表 2 不同耦合模式模拟的中国区域温度和降水气候场偏差及空间相关系数 Table 2 The biases and correlation coefficients between observed and simulated climatology field of temperature and precipitation over China with different coupled general circulation models |
从以上分析可以看出,对多年气候场各模式都存在系统误差,事实上对于年代际变化,评估相对于平均态的距平场更有意义,这里用模拟值与观测值距平场的均方根误差(Root-Mean-Square Error,RMSE)来表示,
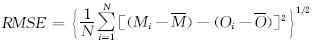
其中,N=8,代表 8个年代际时段(1960s, 1965s,…,1995s),Mi和 分别是各模拟值和8个模拟值的平均;Oi和
 分别代表各时段观测值和1961~2000年平均值。
由图 3可以看出,对于温度变量2组模式具有相近的误差分布,高值区位于我国北方地区,约0.2~0.3 °C,而东南沿海相对较小。而对于降水,尽管ENSEMBLES-MME和CMIP3-MME在中国大部分地区二者具有相近的误差,误差大值区位于西北内陆。
 |
图 3(a、c)CMIP3-MME和(b、d)ENSEMBLES-MME模拟的中国区域(a、b)温度(单位:°C)和(c、d)降水(单位:%)年代际距平值的RMSE分布Fig. 3 The spatial distribution of RMSEs of(a,b)temperature(°C) and (c,d)precipitation(%)simulated with(a,c)CMIP3-MME and (b,d)ENSEMBLES-MME |
为考察耦合模式对年代际变率的模拟(如图 4所示),大部分地区相关系数都在0.75以上(注意对于8个样本,相关系数通过0.05显著性检验的阈值为0.71),尤其是在中国北方相关系数都超过0.90,说明模式对20世纪后期中国北方区域的显著增暖趋势模拟得很成功;而近几十年来四川盆地及其邻近地区(西南地区)有显著的降温趋势(任国玉等,2005),该区的变冷主要存在于春季和夏季。关于春季的变冷,有研究表明它和以北大西洋涛动(North Atlantic Oscillation,NAO)为代表的中高纬度大气环流的年代际变化存在联系(Yu and Zhou, 2004; Li et al., 2005,2008; Xin et al., 2006);而关于夏季的变冷,尽管有研究认为气溶胶有贡献(Qian and Giorgi, 2000),但是在给定气溶胶强迫的情况下,目前的CMIP3耦合气候模式并不能合理再现该冷变化(Zhou and Yu, 2006)。由图 4也可发现,在西南地区CMIP3-MME和ENSEMBLES-MME与观测序列的相关系数皆低于0.70,没有通过显著性检验,说明耦合模式对该区域近几十年来的降温趋势尚不能很好地模拟出来,这可能与现有的模式对中国区域大气环流的年代际变化模拟较差有关(孙颖和丁一汇,2008)。
 |
图 4(a)ENSEMBLES-MME和(b)CMIP3-MME模拟的中国区域1960~2005年8个温度序列与对应观测序列之间相关系数空间分布及(c)区域平均距平序列Fig. 4 The spatial distribution of correlation coefficients of temperature temporal series between observed and simulated with(a)ENSEMBLES-MME and (b)CMIP3-MME, and (c)the China-averaged temporal anomalous series |
总体而言,耦合模式对中国大部分区域的温度年代际变化的模拟是比较好的,这也从中国区域平均温度序列对比(图 4c)可以看出,耦合模式对中国区域20世纪后半叶的增暖趋势模拟都比较成功,但增暖幅度小于观测。ENSEMBLES-MME和CMIP3-MME模拟的中国区域平均年代际序列与观测序列的相关系数分别为0.97和0.95。
对于降水,CMIP3-MME和ENSEMBLES-MME模拟的相关系数在中国大部分地区都很低,但在江淮流域具有一定的模拟能力(图略)。图 5给出了观测(Xie et al., 2007)和CMIP3-MME、ENSEMBLES-MME模拟的中国区域年降水量的年代际变化(1980~2000年平均减去1960~1979年平均)。20世纪后期中国东部降水具有显著的年代际变化特征,由60年代的“南旱北涝”转化为80年代开始的“南涝北旱”(Wang,2001;Yu et al., 2004;Ding et al., 2008;孙颖和丁一汇,2008),在差值图(图 5a)上表现为江淮流域和华南为正值,而华北则为负值。ENSEMBLES-MME和CMIP3-MME模拟的降水年代际变化量级都显著小于观测。而从分布上看,CMIP3-MME模拟的中国东部降水年代际变化场与观测场分布相反,即华北降水反而增多,江淮流域和华南降水减少(图 5b),CMIP3模式的这种缺陷在前文已有所论述(孙颖和丁一汇,2008)。而ENSEMBLES-MME也未能再现20世纪80年代以来华北地区“偏旱”的变化,也许在模式分辨率更高的情况下,更强的地形强迫作用会引起不同结果的出现(Gao et al., 2008);但成功地模拟出了江淮流域和华南沿海降水偏多的特点(图 5c)。
 |
图 5(a)观测、(b)CMIP3-MME模拟、(c)ENSEMBLES-MME模拟的中国区域年降水量的年代际变化(1980~2000年平均减去1960~1979年平均,单位:%)Fig. 5 Decadal changes of annual precipitation(mean of 1980-2000 minus mean of 1960-1979,units:%)based on(a)observations,(b)CMIP3-MME, and (c)ENSEMBLES-MME |
前述西南地区的变冷以及上述中国东部降水“南涝北旱”的变化,实际上是中国夏季气候年代际变化的共同体现(宇如聪等,2008;Zhou et al., 2008b; Zhou et al., 2009a)。这种变化具有独特的三维结构特征(Yu et al., 2004; Yu and Zhou, 2007),并且利用实际海温的变化来驱动大气环流模式,能够较为合理地模拟再现季风环流的减弱特征和副热带高压的年代际西伸特征(Zhou et al., 2009b;Li et al., 2010)。而采用观测海温同化的ENSEMBLES-MME模式依然未能模拟出华北偏“旱”的变化,这也说明了东亚气候变化的复杂性和模拟研究的困难性。 4 2005~2015年预测
这里基于ENSEMBLES-MME模式利用2005年的观测资料同化,对2005~2015年所做的预测结果,给出中国区域2005~2015年10年平均的气候变化(相对于1971~2000年)。当然应该注意到,如前所述,年代际气候预测模式还有较大的误差,所以这种预测的不确定性是相当大的,还需要观测资料来验证。为便于对比,也给出CMIP3-MME在SRES A1B情形下2005~2015年中国区域的预估结果。
从空间分布看,2组模式都预测中国区域2005~2015年这10年温度将呈全局性增加,但北方增幅大于南方,如东北、华北和西北地区增温都在0.5 °C以上,南方则为0.3~0.4 °C。而在增温幅度方面,CMIP3-MME模拟的增温幅度略大于ENSEMBLES-MME的模拟(图 6a和6b),前者的增温高值中心位于青藏高原和西北内陆,增幅为0.8~0.9 °C,而后者也在西北内陆有一高值中心,但为0.6~0.7 °C。对于2005~2015年的降水变化,2组模式预测的变化量都比较小,且在变化符号和幅度上都具有一定的差异(图 6c和6d)。如两组模式都预测2005~2015年中国西北、青藏高原、东北和黄淮地区降水将略有增加,但CMIP3-MME预测的降水增加的大值区位于西北内陆和青藏高原,增幅为2%~5%;而ENSEMBLES-MME模式预测的降水增加大值区位于东北地区和黄淮-江淮流域,增幅为3%~8%。CMIP3-MME预测南方(华南、东南和西南地区)降水将略有减少;ENSEMBLES-MME模式则仅预测东南沿海和西南降水将偏少,而华南沿海增多。总体而言,两组模式对降水的预测具有一定的差异,这也说明相对与温度和降水的预测具有较大的不确定性。
 |
图 6(a、c)CMIP3-MME和(b、d)ENSEMBLES-MME模拟的2005~2015年中国区域年平均(a、b)温度(单位:°C)和(c、d)降水(单位:%)的变化Fig. 6 The spatial distributions of the predicted changes of(a,b)temperature(°C) and (c,d)precipitation(%)simulated by(a,c)CMIP3-MME and (b,d)ENSEMBLES-MME |
对于各单个模式,表 3给出了ENSEMBLES系列模式和CMIP3模式集成对中国区域2005~2015年温度和降水变化的总体预测结果,可以看出,所有模式都预测温度会增加,增幅在0.3~0.7 °C之间,而降水变化趋势不显著。
| 表 3 各模式对中国区域2005~2015年温度和降水变化的预测(相对于1971~2000年平均) Table 3 Predicted changes of temperature and precipitation over China during 2005-2015(against the mean of 1971-2000) |
利用4个海气耦合模式对1960~2005年的多年代际回报结果,评估这些模式对中国区域年代际气候变化(温度和降水)的预测潜力,同时对2005~2015年气候做了初步预测。与未融入观测资料同化的CMIP3模式集成结果及中国区域格点观测资料进行对比的结果表明,融入观测资料进行同化后耦合模式的模拟技能的确有所改善:
(1)年代际气候预测模式对温度气候场的模拟仍以“冷偏差”为主,但较之CMIP3模式已有显著改进,中国区域平均的冷偏差减少1.3 °C;对降水气候场的模拟仍以“湿偏差”为主,但在华南沿海和西北内陆降水的模拟能力优于CMIP3模式,中国区域平均的湿偏差降低了20%。
(2)年代际模式和CMIP3模式都能较好地模拟出中国区域20世纪后期尤其是北方的增暖信号;但 CMIP3模式对20世纪后期中国东部降水的旱涝结构演变的模拟与观测相反,而年代际气候预测模式则能成功地模拟江淮流域和华南沿海的旱涝演变。
(3)耦合模式对2005~2015年气候的初步预测结果表明,中国区域将继续增暖0.3~0.7 °C,且增温幅度北方大于南方,增幅中心位于西北内陆和青藏高原;而降水的变化趋势不显著,黄淮地区、西北内陆和青藏高原的降水略有增加,而西南地区降水将减少。但需要指出的是,这种预测的不确定性是相当大的。
年代际动力气候预测是当前气候变化领域一个新的研究课题,还有很多新的科学和技术问题有待解决。本文只分析了温度和降水两个基本的要素,而没有分析相应的环流背景及模式对气候系统内部年代际变率(PDO、NAO等)的模拟,事实上对于温度和降水等要素的年代际尺度上的模拟能力很大程度上取决于模式对后者的模拟(刘秦玉等,2010)。除此以外,观测分析和数值模拟已经揭示出热带大洋增暖对过去50~60年东亚季风变化具有重要影响(曾刚等,2007;宇如聪等,2008;Zhou et al., 2009a,2009b; Li et al., 2010),东亚季风的减弱趋势是全球季风降水年代际减弱的区域体现,而利用观测的历史海温资料来驱动大气环流模式,能够在很大程度上合理再现实际观测季风降水的变化(Zhou et al., 2008a)。故耦合模式对东亚季风年代际变化的模拟及预估效果,很大程度上取决于其对热带海洋年代际变化的预测准确度。当然年代际气候模拟也与模式对外部强迫(如温室气体)的响应有关。由本文的分析也可以发现,现有的全球模式在模拟降水的年代际变率还有很大不足,期待未来随着模式的改进(如物理过程和模式分辨率),模式初始化(同化)方案的完善以及观测状况的改善(如对海洋状况尤其是次表层海洋的观测),年代际预测能力能有所提高。
致谢 感谢欧盟ENSEMBLES 项目(GOCE-CT-2003-505539)提供年代际预测模式数据。CMIP3各模式组提供模拟结果,气候模式诊断与比较计划(PCMDI)收集并存储模式输出结果,JSC/CLIVAR 耦合模式工作组(WGCM)组织模式资料分析工作,IPCC 资料存储得到美国能源部科学办公室的支持,IPCC AR4 WGI TSU 在模式结果方面提供技术支持,在此一并致谢。
| [1] | Balmaseda M A, Vidard A, Anderson D L T. 2008. The ECMWF ORA-S3 ocean analysis system[J]. Mon. Wea. Rev., 136(8): 3018-3034, doi: 10.1175/2008MWR2433. 1. |
| [2] | Collins W J, Bellouin N, Doutriaux-Boucher M, et al. 2008. Eva-luation of the HadGEM2 model[R]. Tech. Note HCTN 74, Met Off. Hadley Cent., Exeter, U.K. (http://www.metoffice.gov.uk/publications/HCTN/index.html[2010-05-12]). |
| [3] | Daget N, Weaver A T, Balmaseda M A. 2009. Ensemble estimation of background-error variances in a three-dimensional variational data assimilation system for the global ocean[J]. Quart. J. Roy. Meteor. Soc., 135(641): 1071-1094, doi: 10.1002/qj. 412. |
| [4] | Ding Y H, Wang Z Y, Sun Y. 2008. Inter-decadal variation of the summer precipitation in East China and its association with decreasing Asian summer monsoon. Part I: Observed evidences[J]. Int. J. Climatol., 28(9): 1139-1161, doi: 10.1002/joc. 1615. |
| [5] | Doherty S J, Bojinski S, Henderson-Sellers A, et al. 2009. Lessons learned from IPCC AR4: Scientific developments needed to understand, predict, and respond to climate change[J]. Bull. Amer. Meteor. Soc., 90(4): 497-513, doi: 10.1175/2008BAMS2643. 1. |
| [6] | 高学杰, 徐影, 赵宗慈, 等. 2006. 数值模式不同分辨率和地形对东亚降水模拟影响的试验[J]. 大气科学, 30(2): 185-192. Gao Xuejie, Xu Ying, Zhao Zongci, et al. 2006. Impacts of horizontal resolution and topography on the numerical simulation of East Asian precipitation[J]. Chinese Journal of Atmospheric Sciences (in Chinese), 30(2): 185-192. |
| [7] | Gao X, Shi Y, Song R, et al. 2008. Reduction of future monsoon precipitation over China: Comparison between a high resolution RCM simulation and the driving GCM[J]. Meteor. Atmos. Phys., 100(1-4): 73-86, doi: 10. 1007/s00703-008-0296-5. |
| [8] | Jungclaus J H, Keenlyside N S, Botzet M, et al. 2006. Ocean circulation and tropical variability in the coupled model ECHAM5/MPI-OM[J]. J. Climate, 19(16): 3952-3972, doi: 10.1175/JCLI3827. 1. |
| [9] | Keenlyside N S, Latif M, Jungclaus J, et al. 2008. Advancing deca-dal-scale climate prediction in the North Atlantic sector[J]. Nature, 453(7191): 84-88, doi:10. 1038/nature06921. |
| [10] | Keith H, Leon H, Liu C L, et al. 2009. Decadal climate prediction (project GCEP)[J]. Philosophical Transactions of the Royal Society (A: Mathematical, Physical and Engineering Sciences), 367(1890): 925-937, doi: 10.1098/rsta.2008. 0178. |
| [11] | Li H M, Dai A G, Zhou T J, et al. 2010. Responses of East Asian summer monsoon to historical SST and atmospheric forcing du-ring 1950-2000[J]. Climate Dyn., 34(4): 501-514, doi: 10. 1007/s00382-008-0482-7. |
| [12] | Li J, Yu R C, Zhou T J, et al. 2005. Why is there an early spring cooling shift downstream of the Tibetan Plateau[J]. J. Climate, 18(22): 4660-4668, doi: 10.1175/JCLI3568. 1. |
| [13] | Li J, Yu R C, Zhou T J. 2008. Teleconnection between NAO and climate downstream of the Tibetan Plateau[J]. J. Climate, 21(18): 4680-4690, doi: 10.1175/2008JCLI2053. 1. |
| [14] | 刘秦玉, 李春, 胡瑞金. 2010. 北太平洋的年代际振荡与全球变暖[J]. 气候与环境研究, 15(2): 217-224. Liu Qinyu, Li Chun, Hu Ruijin. 2010. Interdecadal oscillations in the North Pacific and the global warming[J]. Climatic and Environmental Research (in Chinese), 15(2): 217-224. |
| [15] | Meehl G A, Stocker T F, Collins W D, et al. 2007. Global climate projections[M]// Solomon S, Qin D, Manning M, et al., Eds. Climate Change 2007: The Physical Science Basis. Cambridge: Cambridge University Press, 747-845. |
| [16] | Meehl G A, Goddard L, Murphy J, et al. 2009. Decadal prediction: Can it be skillful?[J]. Bull. Amer. Meteor. Soc., 90(10): 1467-1485, doi: 10.1175/2009 BAMS 2778. 1. |
| [17] | Mochizuki T, Ishii M, Kimoto M, et al. 2010. Pacific decadal oscillation hindcasts relevant to near-term climate prediction[J]. Proceedings of the National Academy of Sciences, 107(5): 1833-1837, doi: 10.1073/pnas. 0906531107. |
| [18] | Pohlmann H, Jungclaus J H, Khl A, et al. 2009. Initializing decadal climate predictions with the GECCO oceanic synthesis: Effects on the North Atlantic[J]. J. Climate, 22(14): 3926-3938, doi: 10.1175/2009JCLI2535. 1. |
| [19] | Qian Y, Giorgi F. 2000. Regional climatic effects of anthropogenic aerosols? The case of southwestern China[J]. Geophys. Res. Lett., 27(21): 3521-3524, doi:10. 1029/2000GL011942. |
| [20] | 任国玉, 郭军, 徐铭志, 等. 2005. 近50年中国地面气候变化基本特征[J]. 气象学报, 63(6): 942-956. Ren Guoyu, Guo Jun, Xu Mingzhi, et al. 2005. Climate changes of Chinas mainland over the past half century[J]. Acta Meteorologica Sinica (in Chinese), 63(6): 942-956. |
| [21] | Smith D M, Cusack S, Colman A W, et al. 2007. Improved surface temperature prediction for the coming decade from a global climate model[J]. Science, 317(5839): 796-799, doi: 10.1126/science. 1139540. |
| [22] | 孙颖, 丁一汇. 2008. IPCC AR4气候模式对东亚夏季风年代际变化的模拟性能评估[J]. 气象学报, 66(5): 765-780. Sun Ying, Ding Yihui. 2008. Validation of IPCC AR4 climate models in simulating interdecadal change of East Asian summer monsoon[J]. Acta Meteorologica Sinica (in Chinese), 66(5): 765-780. |
| [23] | Taylor K E, Stouffer R J, Meehl G A. 2009. A Summary of the CMIP5 Experiment Design, https: //cmip.llnl.gov/cmip5/docs/Taylor_CMIP5_design.pdf[2010-05-12]. |
| [24] | van der Linden P, Mitchell J F B. 2009. ENSEMBLES: Climate Change and Its Impacts: Summary of Research and Results from the ENSEMBLES Project[M]. FitzRoy Road, Exeter EX1 3PB, UK: Met Office Hadley Centre, 160pp. |
| [25] | Wang H J. 2001. The weakening of the Asian monsoon circulation after the end of 1970's[J]. Advances in Atmospheric Sciences, 18(3): 376-386, doi: 10. 1007/BF02919316. |
| [26] | 王会军, 张颖, 郎咸梅. 2010. 论短期气候预测的对象问题[J]. 气候与环境研究, 15(3): 225-228. Wang Huijun, Zhang Ying, Liang Xianmei. 2010. On the predictand of short-term climate prediction[J]. Climatic and Environmental Research (in Chinese), 15(3): 225-228. |
| [27] | Weisheimer A, Doblas-Reyes F J, Palmer T N, et al. 2009. ENSEMBLES: A new multi-model ensemble for seasonal-to-annual predictions-skill and progress beyond DEMETER in forecasting tropical Pacific SSTs[J]. Geophys. Res. Lett., 36: L21711, doi: 10. 1029/2009GL040896. |
| [28] | Xie P P, Chen M Y, Yang S, et al. 2007. A gauge-based analysis of daily precipitation over East Asia[J]. Journal of Hydrometeo-rology, 8(3): 607-626, doi: 10.1175/JHM583. 1. |
| [29] | Xin X G, Yu R C, Zhou T J, et al. 2006. Drought in late spring of South China in recent decades[J]. J. Climate, 19(13): 3197-3206, doi: 10.1175/JCLI3794. 1. |
| [30] | Xu Ying, Gao Xuejie, Shen Yan, et al. 2009. A daily temperature dataset over China and its application in validating a RCM simulation[J]. Advances in Atmospheric Sciences, 26(4): 763-772, doi: 10. 1007/s00376-009-9029-z. |
| [31] | 杨军丽, 郭裕福, 王斌. 2007. 亚洲季风降水的多模式模拟结果分析[J]. 气候与环境研究, 12(4): 533-545. Yang Junli, Guoyufu, Wang Bin. 2007. Analysis of AGCMs in Asian monsoon precipitation simulations[J]. Climatic and Environmental Research (in Chinese), 12(4): 533-545. |
| [32] | Yu R C, Zhou T J. 2004. Impacts of winter-NAO on March cooling trends over subtropical Eurasia continent in the recent half century[J]. Geophys. Res. Lett., 31: L12204, doi: 10. 1029/2004 GL019814. |
| [33] | Yu R C, Wang B, Zhou T J. 2004. Tropospheric cooling and summer monsoon weakening trend over East Asia[J]. Geophys. Res. Lett., 31: L22212, doi: 10. 1029/2004GL021270. |
| [34] | Yu R C, Zhou T J. 2007. Seasonality and three-dimensional structure of interdecadal change in the East Asian monsoon[J]. J. Climate, 20(21): 5344-5355, doi: 10.1175/2007JCLI1559. 1. |
| [35] | 宇如聪, 周天军, 李建, 等. 2008. 中国东部气候年代际变化三维特征的研究进展[J]. 大气科学, 32(4): 893-905. Yu Rucong, Zhou Tianjun, Li Jian, et al. 2008. Progress in the studies of three-dimensional structure of interdecadal climate change over eastern China[J]. Chinese Journal of Atmospheric Sciences (in Chinese), 32(4): 893-905. |
| [36] | 曾刚, 孙照渤, 王维强, 等. 2007. 东亚夏季风年代际变化: 基于全球观测海表温度驱动NCAR Cam3 的模拟分析[J]. 气候与环境研究, 12(2): 211-224. Zeng Gang, Sun Zhaobo, Wang Weiqiang, et al. 2007. Interdecadal variation of East Asian summer: Monsoon simulated by NCAR Cam3 driven by global SSTs[J]. Climatic and Environmental Research (in Chinese), 12(2): 211-224. |
| [37] | Zhou T J, Yu R C. 2006. Twentieth-century surface air temperature over China and the globe simulated by coupled climate mo-dels[J]. J. Climate, 19(22): 5843-5858, doi: 10.1175/JCLI3952. 1. |
| [38] | Zhou T J, Yu R C, Li H M, et al. 2008a. Ocean forcing to changes in global monsoon precipitation over the recent half century[J]. J. Climate, 21(15): 3833-3852, doi: 10.1175/2008JCLI2067. 1. |
| [39] | Zhou T J, Zhang L X, Li H M. 2008b. Changes in global land monsoon area and total rainfall accumulation over the last half century[J]. Geophys. Res. Lett., 35: L16707, doi: 10. 1029/2008GL034881. |
| [40] | Zhou T J, Gong D Y, Li J, et al. 2009a. Detecting and understanding the multi-decadal variability of the East Asian summer monsoon—Recent progress and state of affairs[J]. Meteor. Z., 18(4): 455-467, doi: 10. 1127/0941-2948/2009/0396. |
| [41] | Zhou T J, Yu R C, Zhang J, et al. 2009b. Why the western Pacific subtropical high has extended westward since the late 1970s[J]. J. Climate, 22(8): 2199-2215, doi: 10.1175/2008JCLI 2527. 1. |