2 中国科学院大学,北京 100049;
3 北京林业大学林学院,北京 100083
2 University of Chinese Academy of Sciences, Beijing 100049;
3 College of Forestry, Beijing Forestry University, Beijing 100083
陆地生态系统碳循环是全球碳收支研究的核心内容之一,是全球碳平衡的重要环节,陆气碳交换的变化能引起大气CO2浓度的明显波动,进而影响全球气候变化(朴世龙等, 2010)。在所有陆地生态系统类型中,半干旱区生态环境脆弱,对气候变化响应敏感,碳源汇功能表现出较大不确定性,对全球陆地碳收支影响显著(彭琴等, 2012; Ahlström et al., 2015)。草原是半干旱区主要植被类型之一(White et al., 2000)。研究半干旱草原碳通量的变化规律,有助于准确认识和预估陆地生态系统的碳源汇性质(黄耀等, 2010)。
一些研究表明半干旱草原有较明显的碳吸收功能(Dong et al., 2011),也有研究指出半干旱草原碳吸收能力有限,其弱碳源或弱碳汇特征在气候因子的影响下容易发生方向性逆转(Flanagan et al., 2002; Biederman et al., 2017)。在不同时间尺度上,半干旱草原碳交换的气候影响因子和对气候变化的响应机制不同。在年际和季节尺度上,降雨量和土壤含水量被认为是影响半干旱草原碳源汇转换的重要因素(Li et al., 2017)。季节尺度上降雨格局的变化影响了土壤含水量的季节变异,间接影响碳交换季节变化(Knapp et al., 2002)。此外,水热交互作用也引起碳通量响应过程的变化(Wu et al., 2011)。而在日尺度上,光合有效辐射是碳交换日变化过程的主要控制因子(Du and Liu, 2013; 王玉辉等, 2014),温度的日变化也影响半干旱草原碳通量日变化过程(汪文雅等, 2015)。但也有研究指出,在部分半干旱草原或在特殊的环境条件下,碳通量的日变化与光合有效辐射或温度没有显著相关性(郝彦宾等, 2006; Jin et al., 2007)。与年际和季节变化相比,半干旱草原碳通量日变化过程的研究较多基于短期观测数据,这对碳交换日变化过程的评价带来较大不确定性(薛红喜等, 2009; 王玉辉等, 2014),尚需要更长时间尺度的高时间分辨率观测资料,以确定半干旱草原碳通量日尺度变化过程和影响机理。
中国半干旱区位于亚非干旱带东部,是区域碳收支变化的重要贡献区之一(缑倩倩等, 2013)。草甸草原和典型草原在中国半干旱区分布较广,是中国北方半干旱区东西水分变化梯度带上干湿条件不同的两种生态系统类型(Wesche et al., 2016)。草甸草原地处亚欧大草原森林到草原过渡带,水分的时空变化较强烈(Dong et al., 2011);典型草原主要分布在内蒙古高原,也是中国气候观测系统(Chinese Climate Observation System, CCOS)建议的多圈层综合监测关键区之一。两种草原类型碳交换对降水量,尤其是夏季降水量的变化响应敏感(Du and Liu, 2013; Zhao et al., 2019)。已有研究预估未来中国北方半干旱区夏季降雨减少,干旱事件增加(Qin et al., 2018)。草甸草原和典型草原的固碳能力在这种区域气候变化影响下将发生显著改变(郝彦宾等, 2006; Jing et al., 2014; 汪文雅等, 2015)。但中国半干旱草原长期通量观测站较少(Chen et al., 2013),造成对这一区域碳循环的认识仍有较大不足。本文基于中国半干旱区吉林通榆草甸草原2011~2017年涡动相关法观测的通量数据和内蒙古毛登典型草原2013~2017年观测数据,分析两种生态系统碳通量日变化过程的特征和差异,探讨两种生态系统碳通量对多种环境因子响应的相似性与差异性,为进一步研究温带半干旱草原碳循环过程提供依据。
2 资料和方法 2.1 研究区概况本研究的2个通量观测站均属于温带大陆性气候,夏季炎热冬季寒冷,降水量较少且主要集中在夏季。2个站点下垫面均开阔平坦,地形起伏较小(<3%),植被生长季均为5~9月。
通榆站位于吉林省白城市通榆县,地处科尔沁草原东陲,地理位置(44.34°N,122.92°E),海拔184 m,是中国半干旱区草甸草原的代表站点之一。1985~2017年多年平均降水384 mm,多年日均气温6.1°C。植物种类50余种,优势种为羊草(Leymus chinensis),主要植物种类有鹅绒委陵菜(Potentilla anserine L.)、虎尾草(Chloris virgata Sw.)和达乌里胡枝子(Lespedeza davulica Schindl.)等,杂草群落镶嵌分布,植被盖度约55%(Sun et al., 2014)。土壤由风砂土、淡黑钙土和草甸土组成,局部有盐碱土斑块状分布(姜纪峰等, 2006)。
毛登站位于内蒙古锡林浩特市毛登牧场,地理位置(44.16°N,116.49°E),海拔1200 m,是中国半干旱区典型草原代表站点之一。1985~2017年多年平均降水303 mm,多年日均气温3.1°C。植被建群种为羊草(Leymus chinensis),其他伴生植物有大针茅(Stipa grandis)、糙隐子草(Cleistogenes squarrosa)和克氏针茅(Stipa krylovii)群落等,植被覆盖度约45%(赵康和宝音陶格涛, 2014)。土壤类型为栗钙土。
2.2 涡动相关系统观测和数据采集2个草原生态系统的通量数据来自涡动相关系统观测。2个台站均架设20 m梯度观测塔。涡动相关系统由开路式CO2/H2O分析仪(LI-7500,LI-COR,Lincoln,USA)、三维超声风速仪(CSAT3,Campbell Scientific,Logan,USA)和数据采集器(CR3000,Campbell Scientific,Logan,USA)组成。通榆站CO2/H2O分析仪与三维超声风速仪架设高度为2 m,毛登站为8 m,采样频率10 Hz。辅助数据包括地面以上1 m、2 m、4 m、8 m和16 m的空气温湿度(HMP155,Vaisala,Helsinki,Finland)、地面以上2 m高度向上和向下的长波辐射(CG4,Kipp & Zonen,Delft,Netherlands)、短波辐射(CM21,Kipp & Zonen,Delft,Netherlands)和降水(TE525M,Campbell Scientific,Logan,USA)等。通榆站土壤温度(CS109,Campbell Scientific,Logan,USA)和土壤含水量(CS616,Campbell Scientific,Logan,USA)在地表以下5 cm、10 cm、20 cm、30 cm和50 cm处测量,毛登站在地表以下5 cm、10 cm、20 cm、40 cm和60 cm处测量。
2.3 涡动相关数据处理涡动相关法观测数据的后处理采用Eddypro软件(Version 6.2.0,LI-COR),每条数据的时间长度为30 min。资料处理的步骤Zhao et al.(2019)进行了详细描述,主要流程包括:1)剔除野点(Vickers and Mahrt, 1997);2)二维坐标旋转(Wilczak et al., 2001);3)修正通量,如高频损失订正、密度脉冲订正(WPL)(Webb et al., 1980)和Burba修正(Burba et al., 2008)等;4)质量控制,剔除±3.5个标准差范围外的通量数据(Du and Liu, 2013),剔除夜间摩擦风速低于u*阈值的数据(Papale et al., 2006)。
仪器故障、天气状况和质量控制造成通榆站白天21%、夜间54%和毛登站白天29%、夜间62%的观测资料缺失。为得到生态系统生长季较连续的碳通量情况,对缺失时间长度小于3 h的数据空缺采用了线性插值法进行填补。对于生长季白天更长的数据缺失,采用直角双曲线光响应方程进行插值(Falge et al., 2001):
| ${F_{\rm{c}}} = {\rm{}}\frac{{\alpha \cdot{\rm{PAR}}\cdot{P_{{\rm{max}}}}}}{{\alpha \cdot{\rm{PAR}}+{P_{{\rm{max}}}}}}+ {R_{\rm{e}}},$ | (1) |
其中,Fc为碳通量,α为表观量子效率,PAR为光合有效辐射(单位:μmol m−2 s-1),Pmax为最大生态系统光合作用速率(单位:μmol m−2 s−1),Re为生态系统呼吸(单位:μmol m−2 s−1)。对于夜间和非生长季的数据缺失,采用呼吸对温度和水分响应的连乘模型进行填补:
| ${R_{\rm{e}}} = a\cdot\exp \left({b\cdot{T_{\rm{s}}}} \right)\cdot{\rm{SW}}{{\rm{C}}^c},$ | (2) |
其中,Ts为深度5 cm处土壤温度(单位:°C),SWC为深度5 cm处土壤体积含水量(单位:m3 m−3),a、b和c为待拟合参数。两处站点NEE拆分为GPP和Re的算法也通过公式(2)进行。在夜间生态系统总初级生产力(Gross primary productivity, GPP)为0,Re与净生态系统碳交换量(Net ecosystem exchange, NEE)等同,利用夜间通量数据建立起Re与土壤温度和土壤含水量的关系[公式(2)]估算白天Re,并由
| ${\rm{GPP}} = {R_{\rm{e}}} - {\rm{NEE}}$ | (3) |
求得GPP。
2.4 数据分析本研究分析碳通量日变化对环境因子响应关系时,只采用原始观测和计算、非插值产生的NEE、GPP和Re资料,其中,Re只采用夜间观测资料,以避免插值算法和NEE分割算法产生的误差。选取的主要环境因子包括1 m处观测的气温(T)、光合有效辐射(Photosynthetically active radiation, PAR)、饱和水汽压差(Vapor pressure deficit, VPD)和深度5 cm处土壤含水量(Soil water content, SWC)。
为研究不同环境因子对两处草原生态系统NEE、GPP和Re日变化的重要性,同时消除各变量之间的共线性,我们采用主成分分析方法(Vervaet et al., 2002)揭示主导环境因子,同样选取1 m处T、PAR、VPD和5 cm深度SWC为评价因素。另外,为了清楚地显示碳通量日变化随单因素环境因子变化的关系,以多年平均SWC和VPD为基准,将通榆站和毛登站碳通量资料划分为干湿两组,分别拟合碳通量与环境因子关系。其中,通榆站干组SWC<0.18 m3 m−3且VPD>11 hPa,湿组SWC>0.18 m3 m−3且VPD<11 hPa;毛登站干组SWC<0.15 m3 m-3且VPD>11 hPa,湿组SWC>0.15 m3 m−3且VPD<11 hPa。同时,为了分离多个环境因子对碳通量日变化的协同影响,在研究碳通量对气温日变化的响应关系时,仅选取了两处站点生长季日均光合有效辐射前后区间的资料(±1 SD),即通榆站PAR处于830~970 μmol m−2 s−1、毛登站PAR处于950~1150 μmol m−2 s−1的数据;研究碳通量对光合有效辐射日变化的响应关系时,选取两站点生长季日均气温前后区间的资料(±1 SD),即通榆站T在19~23°C、毛登站T在15~19°C时的数据,进行后续拟合研究。
根据散点分布和拟合效果,NEE和GPP对气温变化的关系拟合采用Logistic概率密度曲线:
| $Y = {y_0} + {\rm{}}\frac{{4\cdot A\cdot{\rm{exp}}\left({ - \frac{{X - {x_{\rm{c}}}}}{w}} \right)}}{{{{\left[ {1 + {\rm{exp}}\left({ - \frac{{X - {x_{\rm{c}}}}}{w}} \right)} \right]}^2}}},$ | (4) |
其中,Y为NEE或GPP,y0为曲线位置参数,X为对应的温度,w和A控制拟合方程的扁平程度,曲线上点坐标(xc,y0+A)为极值点,y0+A代表NEE或GPP随气温变化的饱和点(即NEEmax或GPPmax),xc代表NEEmax或GPPmax对应的最优温度。
呼吸对气温变化的关系拟合采用指数函数:
| ${R_{\rm{e}}} = a\cdot{\rm{exp}}(b\cdot{T_{\rm{s}}}),$ | (5) |
其中,Ts为对应土壤温度,a和b为系数,呼吸随温度变化的敏感性Q10=exp(10·b)。
NEE和GPP对光合有效辐射的响应采用渐近线方程拟合[公式(6)](Whitley et al., 2011):
| $ Y = c\cdot{\rm{}}\frac{{X'}}{{X' + d}}, $ | (6) |
其中,X’为对应的PAR,c和d为系数,其中c表征的实际意义为NEEmax或GPPmax,d表征的实际意义为NEE或GPP对PAR变化的响应速率。
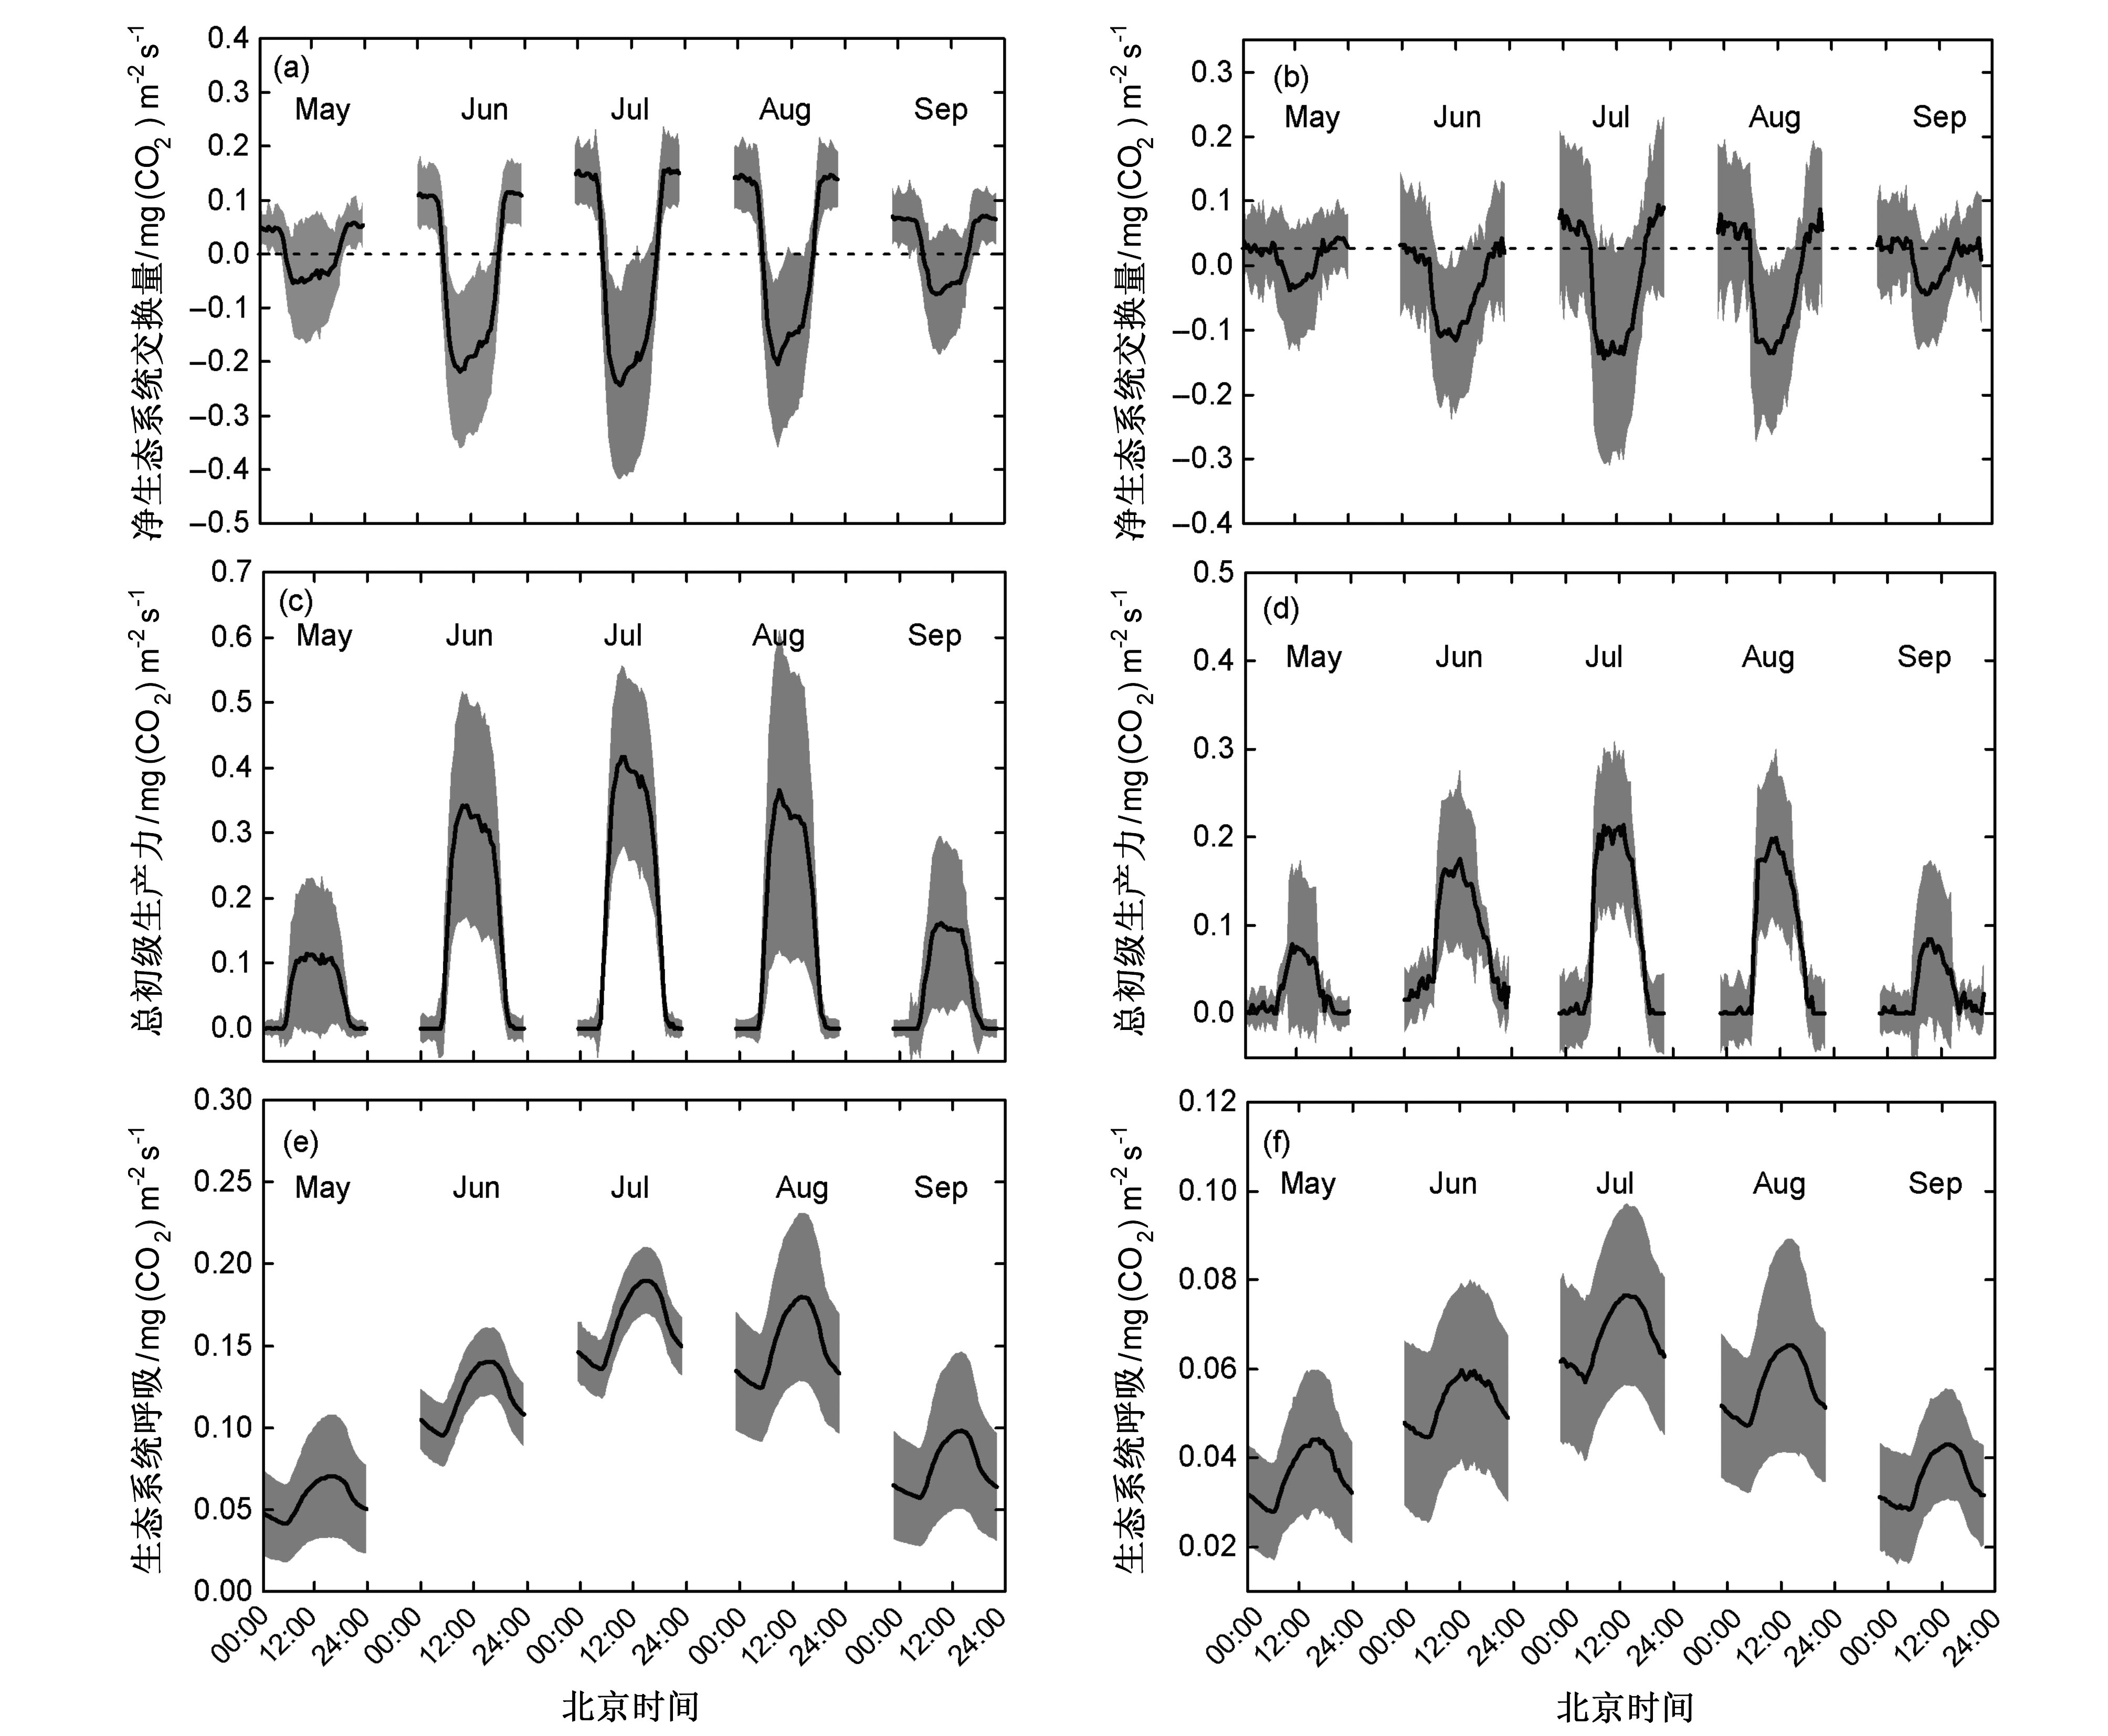
3 结果 3.1 碳通量日变化特征两处半干旱草原站NEE、GPP和Re的月均日变化如图1所示。日出(07:00,北京时间,下同)后,两处草原站光合作用固碳量逐渐大于呼吸作用碳排放量,NEE开始出现负值,植被表现为碳汇。通榆站NEE在10:00前后达到峰值,此后随着GPP的降低,10:00至15:00净固碳速率缓慢下降,而后迅速下降,至18:00前后NEE逐变为0;夜间由于植被和土壤的呼吸作用,草地变为碳源,NEE为正值。毛登站NEE在12:00前后出现峰值,而后净固碳速率下降,18:00前后草地开始转变为碳源。通榆站作为草甸草原生态系统,生长季各月份的GPP、Re和净碳交换速率最大值均高于毛登典型草原(表1)。虽然NEE、GPP和Re的月均日变化格局相似,但不同月份波动范围差异较大(图1)。5月NEE、GPP和Re的峰值较低(表1)。6~8月,适宜的生长条件使植被地上生物量迅速累积,草地日间碳吸收速率和夜间碳释放速率均明显增大,两处草原最大固碳速率均出现在7月。9月以后,草原进入生长季末期,固碳速率显著下降。

|
图 1 通榆站(左列)和毛登站(右列)生长季(a、b)净生态系统交换量、(c、d)总初级生产力和(e、f)生态系统呼吸月均日动态。黑色曲线表征多年平均值,灰色阴影为标准差 Fig. 1 Average diurnal dynamics of net ecosystem exchange (NEE), gross primary production (GPP), and ecosystem respiration (Re) in each month during the growing season at Tongyu site (left panel) and Maodeng site (right panel). The black lines indicate the multiyear average values and the grey shadows indicate standard deviations |
|
|
表 1 通榆和毛登站生长季各月NEE、GPP和Re峰值 Table 1 Peak values of net ecosystem exchange, gross primary production, and ecosystem respiration in each month during the growing season at Tongyu and Maodeng sites mg(CO2) m−2 s−1 |
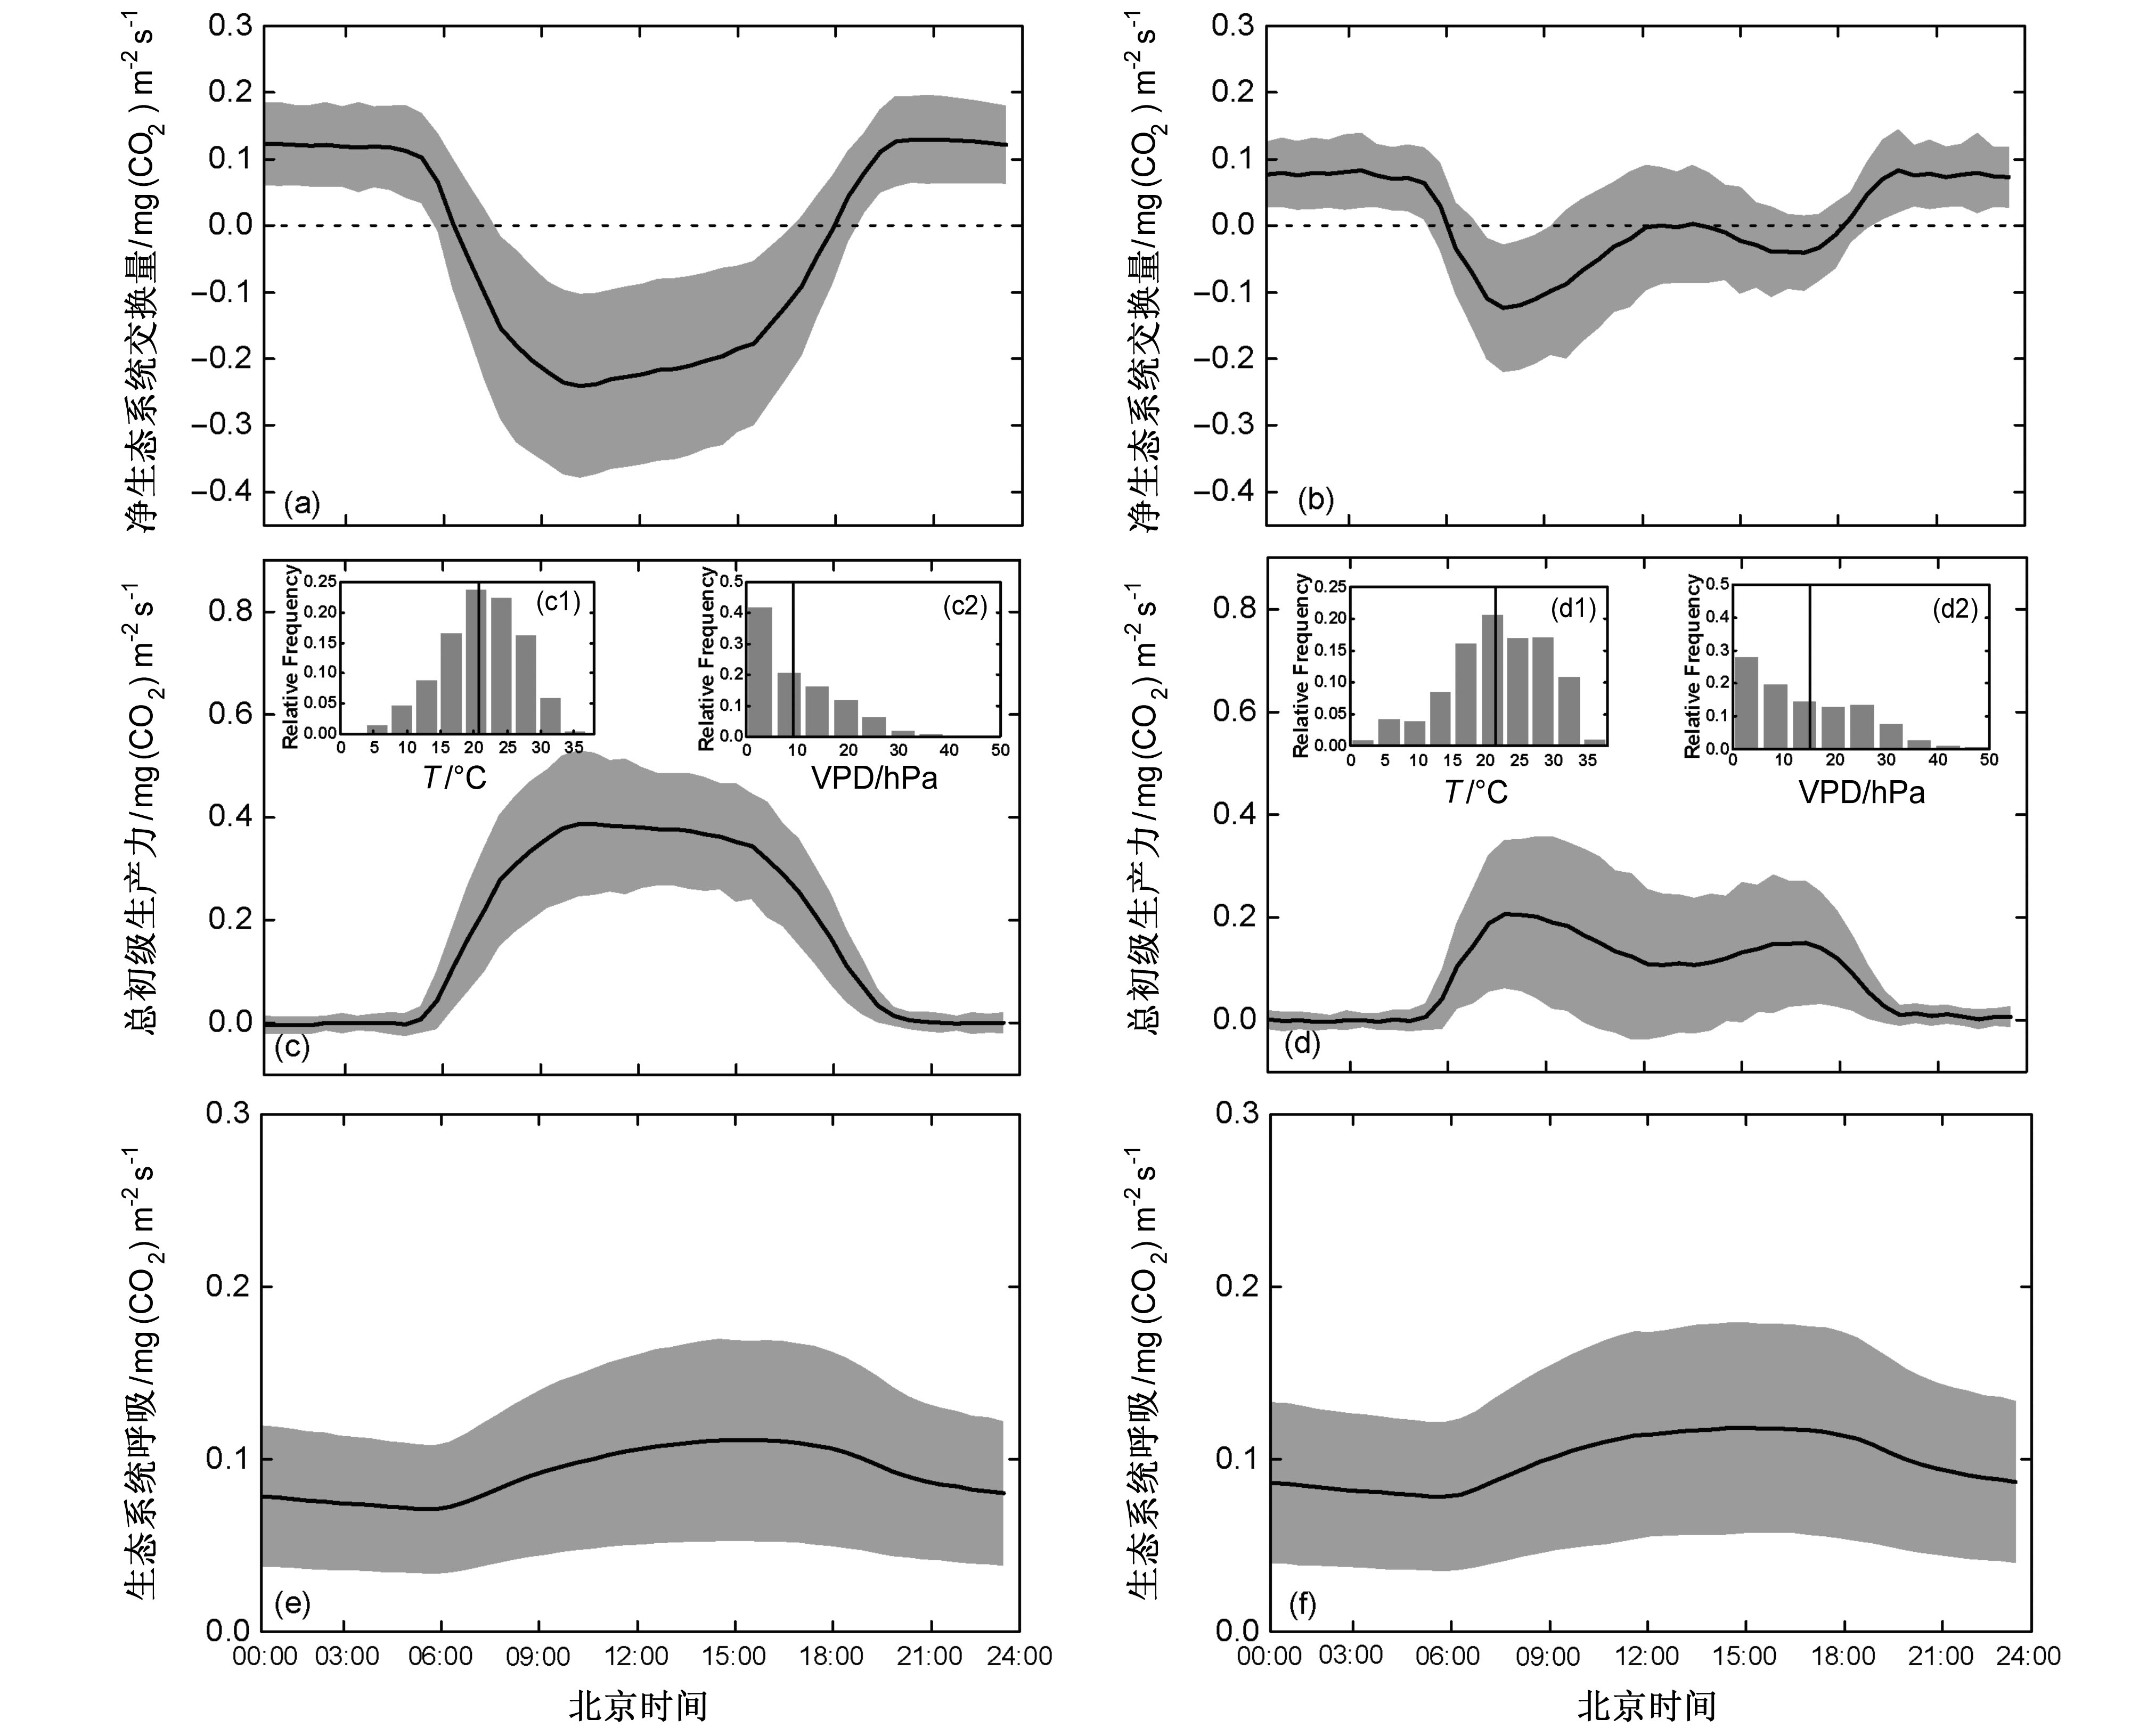
以碳通量高峰出现的次数为依据,可以把所有通榆和毛登站生长季晴天碳交换的日进程分为两种不同类型:一种是NEE只有一个吸收高峰,另一种是NEE具有两个吸收高峰(图2和图3),即通榆和毛登站NEE分别在08:00和11:00前后达到每日第一个吸收高峰后,净固碳速率逐渐下降,13:00前后净固碳速率降到最低,甚至转为碳释放,13:00以后净固碳速率再次增加,并在16:00前后达到第二个吸收高峰。之后固碳速率下降,约18:00前后草地变为碳源。生长季GPP日变化为单吸收峰特征的天数在通榆站和毛登站占比约85%和80%,双吸收峰在两处站点分别占生长季总日数的15%和20%,主要出现在7月、8月。将NEE和GPP、Re日变化过程对比发现,NEE单峰或双峰的变化特征与GPP一致。对比GPP出现单双峰特征时的日均气温(T)和饱和水汽压差(VPD)分布特征发现,T的差异不明显(通榆站GPP日变化为单峰的平均日均T为21.06°C,双峰21.72°C,毛登站单峰16.34°C,双峰16.97°C),但出现双吸收峰特征时,日均VPD更大(通榆站GPP日变化为单峰的平均日均VPD为9.80 hPa,双峰14.30 hPa,毛登站单峰10.78 hPa,双峰13.10 hPa)(图2c1和2c2、2d1和2d2、3c1和3c2、3d1和3d2)。

|
图 2 通榆站生长季晴天所有单峰型(左列)和双峰型(右列)(a、b)NEE、(c、d)GPP、(e、f)Re的日变化过程。阴影表示标准差。图2c1、c2和d1、d2分别为日均气温(T)和饱和水汽压差(VPD)的分布,竖线指示平均日均T和VPD Fig. 2 Average unimodal (left panel) and bimodal (right panel) diurnal dynamics of (a, b) NEE, (c, d) GPP, (e, f) Re of sunny days during the growing season at Tongyu site. The gray shadows indicate the standard deviations. Fig. 2c1, c2 and 2d1, d2 show the diurnal average air temperature (T) and vapor pressure deficit (VPD). The vertical lines in the inset figures indicate the average diurnal average T and VPD |
3.2 碳通量日变化影响因素
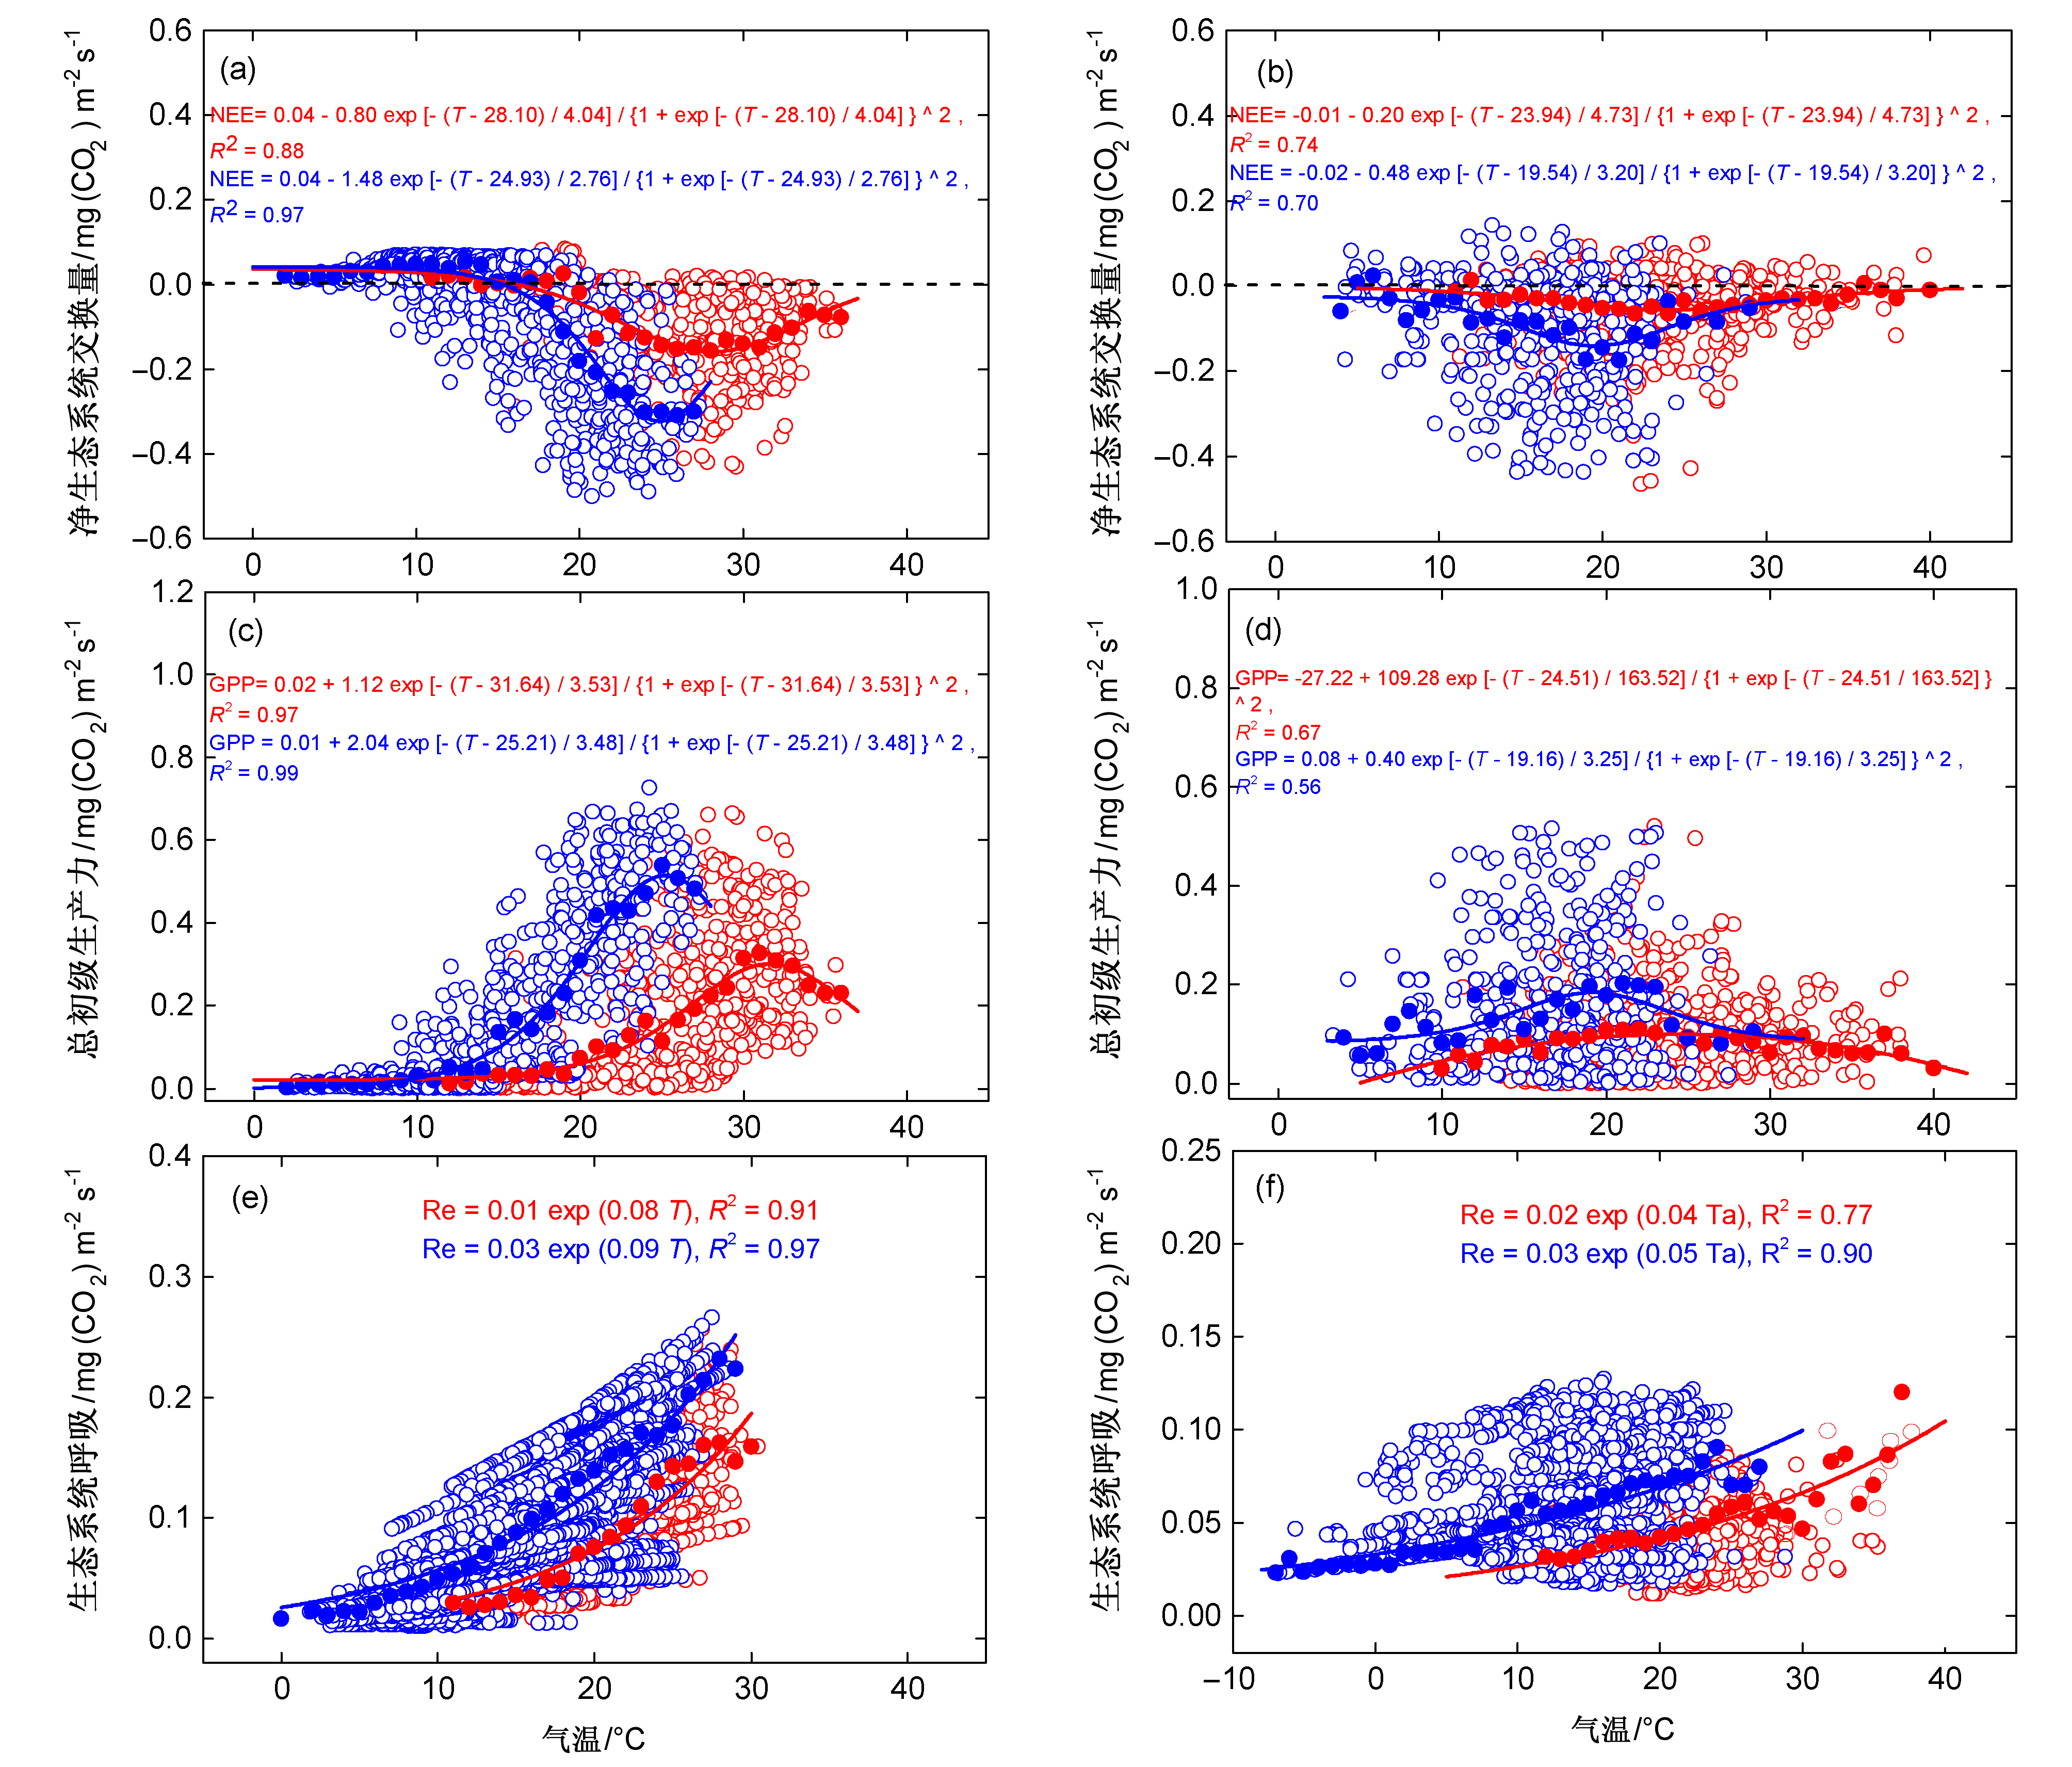
图4给出了通榆站和毛登站不同水分条件下生长季NEE、GPP和Re随气温变化的响应曲线。水分亏缺条件下,碳通量交换速率显著低于水分充足状况下的交换速率。NEE和GPP随气温变化的关系并非线性。当通榆站和毛登站的气温分别低于15°C和10°C时,NEE基本处于0值附近;气温继续升高,固碳速率增加;当气温升高到一定程度时,固碳速率达到最大,而后随气温升高逐渐降低。NEE和GPP随气温变化的响应曲线显示,干湿条件下通榆站净碳交换速率的最适温度分别为28.10°C和24.93°C,光合作用的最适温度分别为31.64°C和25.21°C;毛登站较干和较湿润条件下净固碳速率对应的最适温度分别为23.94°C和19.54°C,GPP的最适温度分别为24.51°C和19.16°C。两站相比,通榆草甸草原站碳交换的最适温度比毛登典型草原站更高。Re随温度变化的过程与NEE和GPP不同,随气温升高呈指数增加趋势。与毛登典型草原相比,通榆草甸草原呼吸对温度变化的敏感性更高,较干和较湿润条件下的Q10分别为2.23和2.46,而毛登站较干和较湿润条件下Q10分别为1.49和1.65。在两处站点上,水分亏缺均降低了呼吸随温度变化的敏感性(Q10)。

|
图 4 通榆站(左列)和毛登站(右列)(a、b)NEE、(c、d)GPP、(e、f)Re对T的响应曲线。红色和蓝色点分别代表干、湿组,划分标准为:通榆干组SWC<0.18 m3 m−3且VPD>11 hPa;通榆湿组SWC>0.18 m3 m−3且VPD<11 hPa;毛登干组SWC<0.15 m3 m−3且VPD>11 hPa;毛登湿组SWC>0.15 m3 m−3且VPD<11 hPa Fig. 4 Responses of (a, b) NEE, (c, d) GPP, and (e, f) Re to T at Tongyu (left panel) and Maodeng (right panel) sites. The blue and red circles indicate the dry and wet groups, respectively. The criteria for distinguishing dry and wet groups are SWC<0.18 m3 m−3 and VPD>11 hPa for the Tongyu dry groups; SWC>0.18 m3 m−3 and VPD<11 hPa for the Tongyu wet groups; SWC<0.15 m3 m−3 and VPD>11 hPa for the Maodeng dry groups; and SWC > 0.15 m3 m−3 and VPD<11 hPa for the Maodeng wet groups |
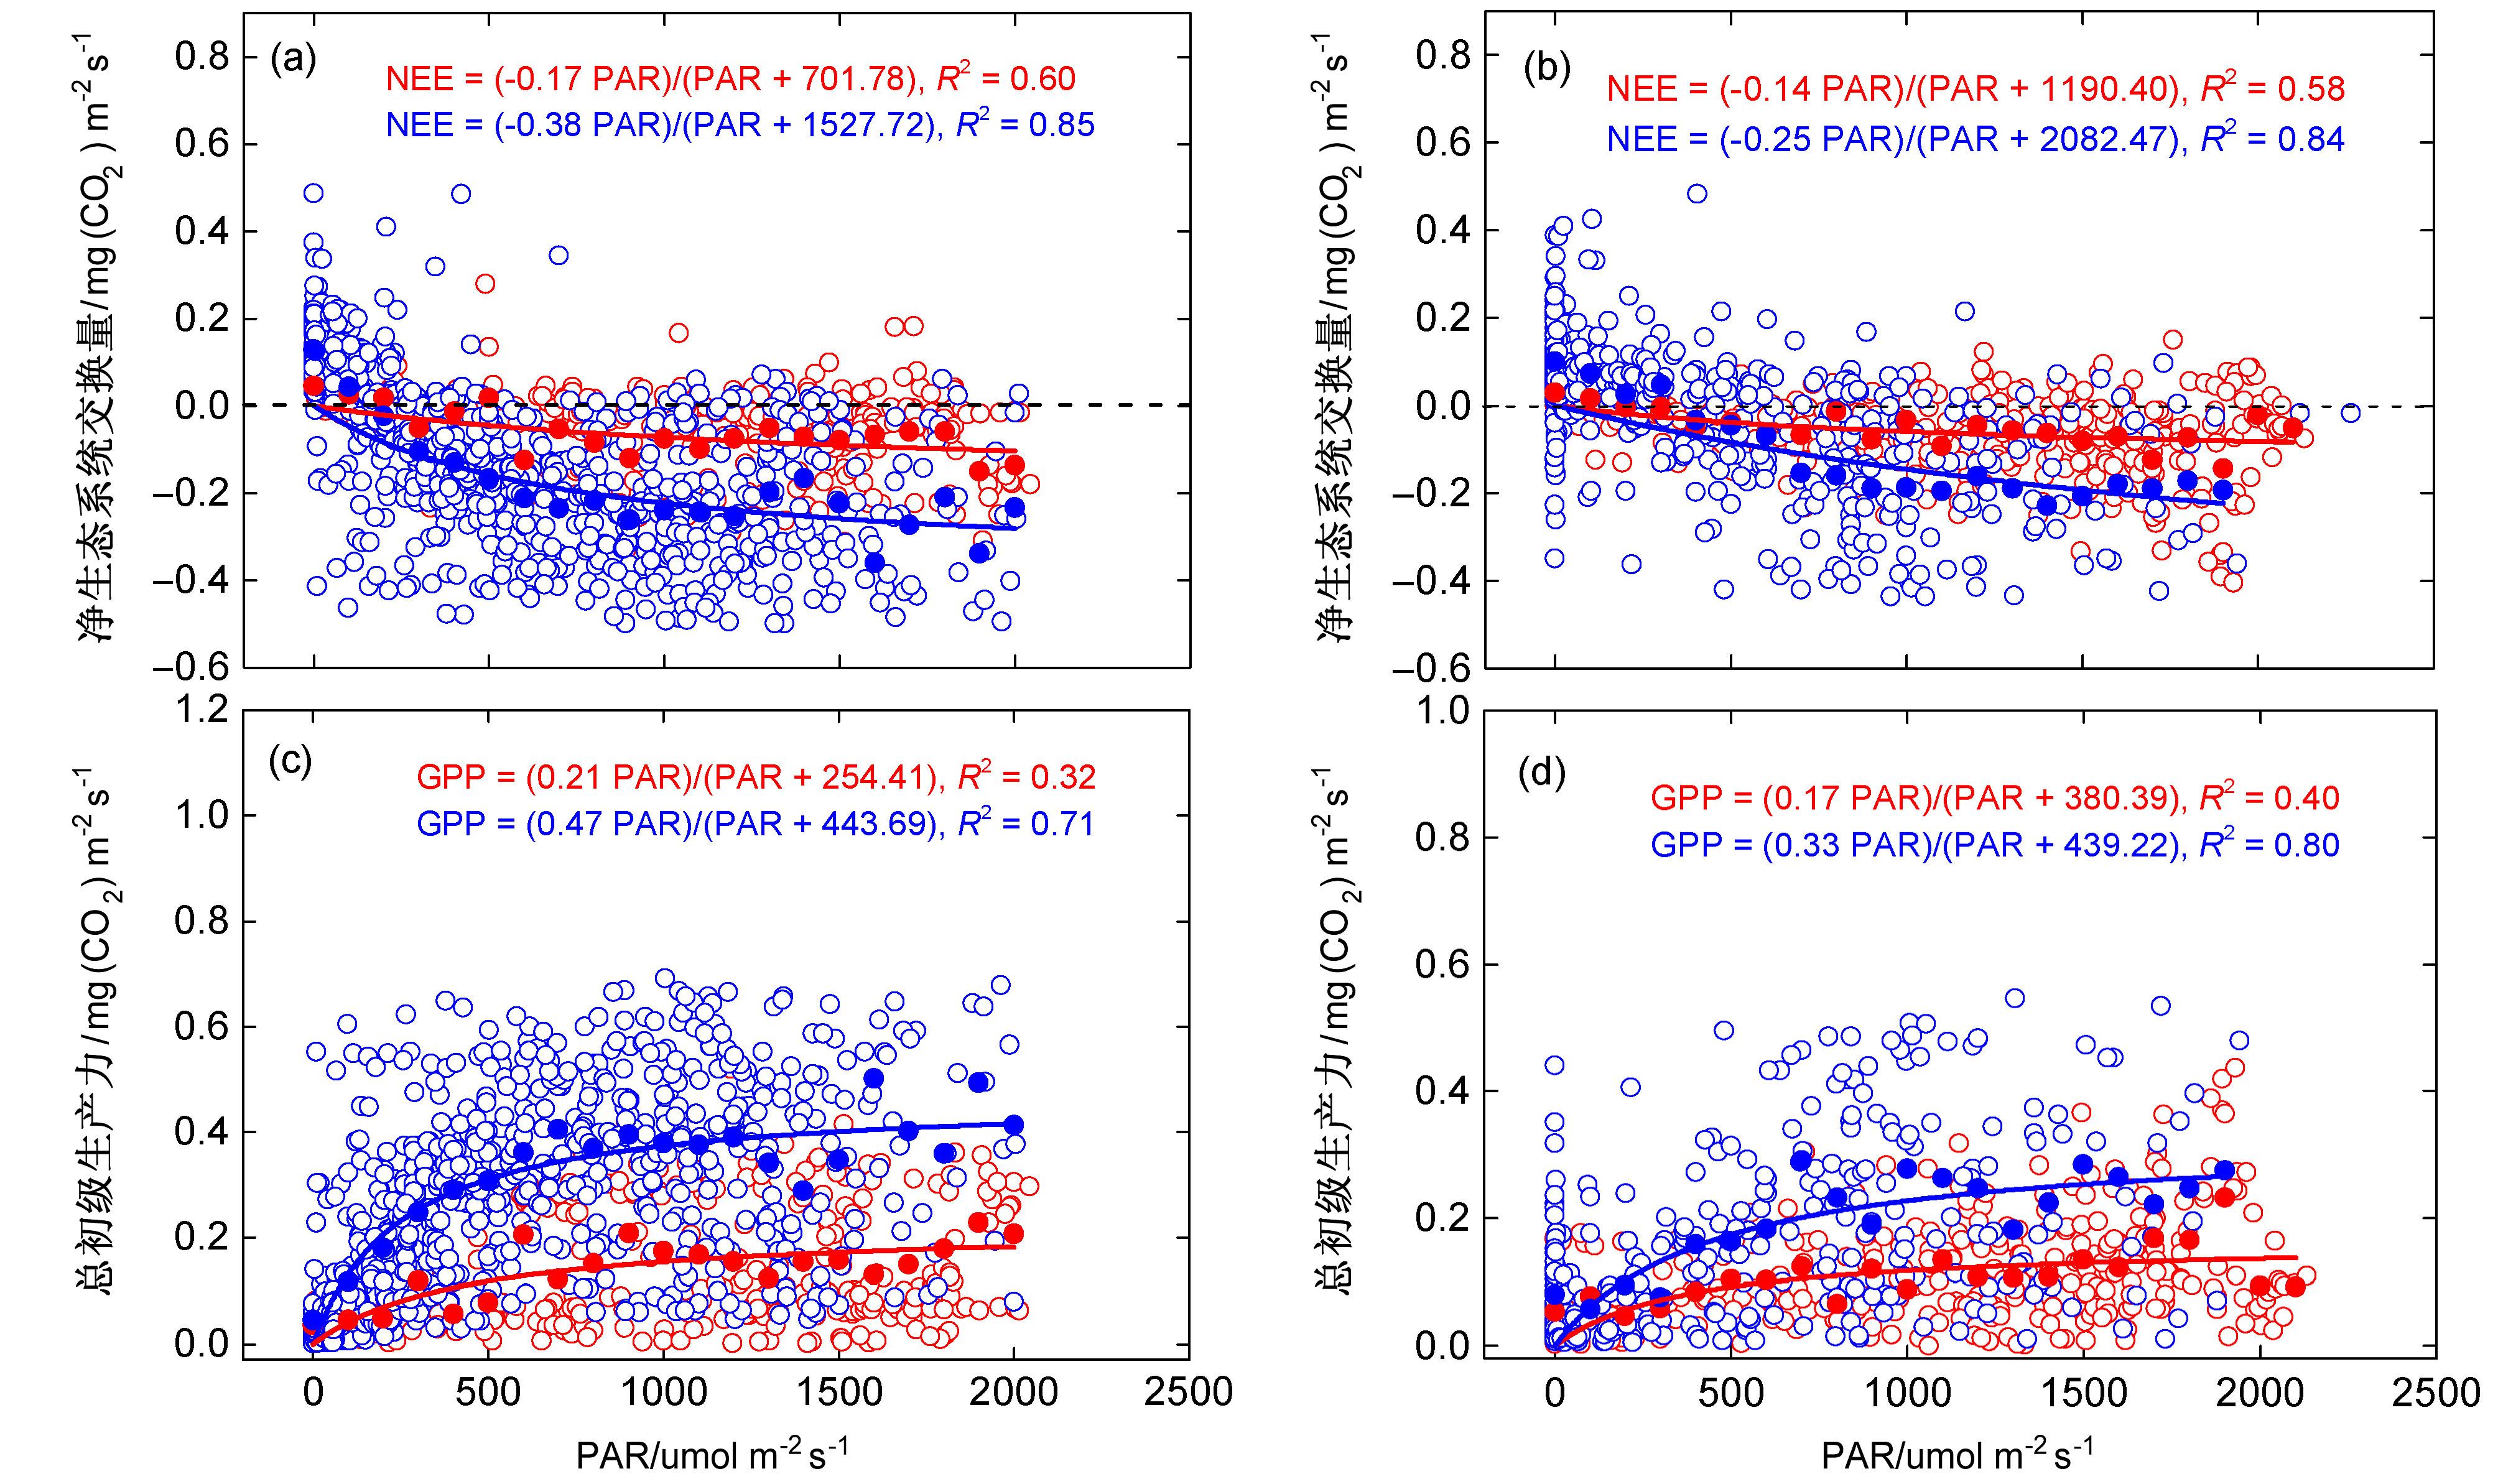
通榆和毛登站NEE和GPP对PAR的响应呈渐近线趋势(图5)。PAR在0~500 μmol m−2 s−1时,GPP随PAR的增加快速增加,而后缓慢增加并逐渐接近最大固碳速率。两处站点较干组拟合方程中,表征碳通量响应速率的拟合参数均小于较湿润条件时的值,说明水分亏缺降低了NEE和GPP对光合有效辐射变化的敏感性。两处站点相比,无论较干组还是较湿润组,通榆站NEE和GPP的饱和点(较干组NEEmin=−0.17 μmol m−2 s−1,GPPmax=0.21 μmol m−2 s−1,较湿组NEEmin=−0.38 μmol m−2 s−1,GPPmax=0.47 μmol m−2 s−1)均高于毛登站(较干组NEEmin=−0.14 μmol m−2 s−1,GPPmax=0.17 μmol m−2 s−1,较湿组NEEmin=−0.25 μmol m−2 s−1,GPPmax=0.33 μmol m−2 s−1),说明通榆草甸草原的固碳能力高于毛登典型草原。但水分亏缺时,通榆站NEE和GPP的饱和点分别降低了55.26%和55.32%,而毛登站NEE和GPP的饱和点分别降低了44.00%和48.48%,通榆草甸草原碳汇强度降低更多,对水分亏缺的敏感度更高。

|
图 5 通榆站(左列)和毛登站(右列)(a、b)NEE、(c、d)GPP对光合有效辐射(PAR)的响应曲线。红色和蓝色点分别代表干、湿组,划分标准为:通榆干组SWC<0.18 m3 m-3且VPD>11 hPa;通榆湿组SWC>0.18 m3 m−3且VPD<11 hPa;毛登干组SWC<0.15 m3 m−3且VPD>11 hPa;毛登湿组SWC>0.15 m3 m−3且VPD<11 hPa Fig. 5 Responses of (a, b) NEE, (c, d) GPP to photosynthetically active radiation (PAR) at Tongyu (left panel) and Maodeng (right panel) sites. The blue and red circles indicate the dry and wet groups. The criteria for distinguishing dry and wet groups are SWC<0.18 m3 m−3 and VPD>11 hPa for the Tongyu dry groups; SWC>0.18 m3 m−3 and VPD<11 hPa for the Tongyu wet groups; SWC<0.15 m3 m−3 and VPD>11 hPa for the Maodeng dry groups; and SWC>0.15 m3 m−3 and VPD<11 hPa for the Maodeng wet groups |
利用主成分分析法研究不同环境因子对两处草原生态系统碳通量日变化的影响程度。图6为主成分分析结果,横坐标为第一主成分,纵坐标为第二主成分,各因素向量在二维空间上的距离远近指示因素在该方向的相关性大小。结果显示,通榆站第一主成分和第二主成分解释了碳通量变化的41.80%和19.61%,第一主成分包括的环境因子主要有T、VPD和PAR(图6a)。GPP和PAR、Re和T在二维空间上的距离较近,而NEE和PAR在相反方向上距离较近,可见GPP和Re生长季日变化过程的主导因子分别是PAR和T,NEE生长季日变化由PAR主导,并呈负相关关系。毛登站第一主成分和第二主成分解释了碳通量变化的44.85%和22.11%,与通榆站不同,T、VPD、PAR和SWC均包含在第一主成分构成中,SWC也是影响毛登站碳通量日变化过程的主要因素(图6b)。毛登站GPP日变化过程主要受PAR和SWC影响,Re日变化主要受SWC影响。由于Re和GPP高度相关,因此Re也体现出与PAR的相关性。PAR和SWC共同主导了毛登站NEE日变化过程。

|
图 6 (a)通榆站和(b)毛登站NEE、GPP和Re日变化影响因子的主成分分析图(括号中百分数为主成分贡献率。红色箭头代表碳通量,蓝色箭头代表环境因子) Fig. 6 Principal component analysis on the influencing factors of diurnal dynamics of NEE, GPP, and Re at (a) Tongyu and (b) Maodeng sites. The percentages in parentheses are the contribution rates of each principal component. Red and blue arrows indicate carbon fluxes and influencing factors, respectively |
通过分析两处草原站多年连续观测数据发现,通榆草甸草原最大净碳吸收速率为−0.50 mg(CO2) m−2 s−1,毛登典型草原为−0.45 mg(CO2) m−2 s−1,均出现在7月(表1)。与全球其他相似草原生态系统相比,本研究中两处草原净碳吸收速率和俄克拉荷马州混合草原相似[−0.4~−0.68 mg(CO2) m−2 s−1](Li et al., 2003),远低于德克萨斯州高草草原[−1.5 mg(CO2) m−2 s−1](Hunt et al., 2002)。和东亚半干旱区其他草原生态系统相比,两处草原的结果高于克氏针茅草原生态系统的碳吸收峰值[−0.16 mg(CO2) m−2 s−1](薛红喜等,2009)。通榆站结果略低于草甸草原观测到的碳吸收峰值[−0.62~−0.98 mg(CO2) m−2 s−1](Dong et al., 2011; Jing et al., 2014; Shao et al., 2017)。而对于典型草原,不同研究的差异较大[−0.16~−0.68 mg(CO2) m−2 s−1](Li et al., 2005; Hao et al., 2008; Shao et al., 2017),毛登站的结果处于其他研究的结果区间内。
在生长季的大部分晴天,草甸草原和典型草原站NEE的日变化过程都表现出单吸收峰特征,双吸收峰主要出现在7月、8月。部分在温带半干旱草原开展的相似研究仅得出了NEE日变化具有单吸收峰的特征(王玉辉等, 2014; 汪文雅等, 2015)。郝彦宾等(2006)和薛红喜等(2009)对半干旱草原的研究得到了与本文相似的单双峰两类碳吸收峰类型,但NEE双峰特征出现的时间不同,如薛红喜等(2009)的研究显示克氏针茅草原双吸收峰的特征主要发生在10月。通过对比NEE单双峰曲线相对应的GPP和Re变化特征,以及主要环境因子发现,NEE日变化呈双峰型主要是由于夏季正午饱和水汽压差增大,限制了保卫细胞的膨胀和气孔的开张,引起午间GPP降低(图2b和2e,图3b和3e)(Kim and Verma, 1990)。Fu et al.(2006)在半干旱草原的研究也得到相似结论,固碳速率正午前后的降低是由于水分胁迫的影响。
4.2 草甸草原和典型草原碳通量对环境因子响应的相似性和异质性草甸草原和典型草原是中国半干旱区典型生态系统类型,同处于温带大陆性气候区,受温带季风气候影响,是中国北方半干旱区经向水分变化梯度带上较湿润和较干旱的不同生态系统类型(Qi et al., 2012)。前期研究表明,两处草原站碳通量季节变化和年变化受水分影响显著,对环境因子的响应体现出较多相似性(Zhao et al., 2019)。对于更高时间分辨率的日变化过程,草甸草原和典型草原碳通量变化的主导因子与季节变化和年变化的主导因子不同,对环境因子的响应存在相似性,也体现出明显的差异性。
草甸草原和典型草原碳通量日变化对环境因子的基本响应关系一致。植被生长需要适宜温度,但温度过高时往往伴随水分亏缺,同时改变了光合作用相关的酶活性(Niu et al., 2008; Biederman et al., 2017),因此草甸草原和典型草原的NEE和GPP均随气温先升高后降低,Re则随气温升高的指数型增加(图3)。PAR是影响白天GPP变化的主要环境因子。PAR在500 μmol m−2 s−1以下时,碳交换速率随光合有效辐射升高而迅速增加,光合有效辐射在1000 μmol m−2 s−1以上时,碳通量随光合有效辐射变化程度逐渐减小,并接近饱和(图5),这与多数文献的研究结果较一致(李琪等,2010;汪文雅等,2015)。本研究中,水分亏缺不仅降低草甸草原和典型草原碳交换速率,也改变了NEE、GPP和Re随温度和光合有效辐射变化的敏感度(图4和图5),间接影响了碳通量变化。
虽然温度、光合有效辐射和水分都是影响草甸草原和典型草原碳通量日变化过程的环境因子(彭琴等, 2012),但在两处草原生态系统的主导因子不同(图6)。PAR和T是主导草甸草原GPP和Re日变化的环境因子,NEE日变化主要由PAR主导。但典型草原的降水量更低,水分亏缺更显著(Wesche et al., 2016)。因此,SWC也是草甸草原NEE、GPP和Re日变化的主导因子。在水分胁迫条件下,草甸草原表现出更强的敏感性,固碳能力的降低比典型草原更多(图5)。其他研究也显示,对于较湿润的半干旱生态系统类型,植被地上生物量或生产力随水分变化的敏感性比较干旱的类型更高(Guo et al., 2012; Hsu et al., 2012)。这可能与不同生态系统的水分利用策略有关。与典型草原相比,草甸草原水分利用策略更开放,对水分变化更敏感(Paruelo et al., 1999; Bai et al., 2008)。除水分条件外,两处草原站对气温的适应性也有所不同,草甸草原碳交换日变化的最适温度比毛登站更高(图4)。由于通榆站年平均温度(6.1°C)比毛登站(3.1°C)更高,这可能是植被对环境长期适应的结果(Fu et al., 2006)。
5 结论本文分析比较了中国半干旱区草甸草原和典型草原生长季碳通量日变化特征和对环境因子的响应。两处草原净碳吸收速率最大值出现在7月,分别为−0.50 mg(CO2) m−2 s−1和−0.45 mg(CO2) m−2 s−1,草甸草原的固碳能力高于典型草原。NEE、GPP和Re的日变化以单峰型曲线为主,但夏季饱和水汽压差较高时,两处草原正午前后NEE日变化呈双峰型。
光合有效辐射是草甸草原NEE日变化的主导因子,而在典型草原站,光合有效辐射和浅层土壤含水量共同主导了NEE的日变化过程。草甸草原碳交换的最适温度高于典型草原,GPP和NEE随光合有效辐射变化的饱和点也高于典型草原。两处草原的固碳速率被水分胁迫显著抑制,但草甸草原碳通量对水分胁迫的敏感度比典型草原更高。水分亏缺也通过改变碳通量对温度和光合有效辐射的响应关系,间接影响碳通量变化。
Ahlström A, Raupach M R, Schurgers G, et al. 2015. The dominant role of semi-arid ecosystems in the trend and variability of the land CO2 sink
[J]. Science, 348(6237): 895-899. DOI:10.1126/science.aaa1668 |
Bai Y F, Wu J G, Xing Q, et al. 2008. Primary production and rain use efficiency across a precipitation gradient on the Mongolia Plateau[J]. Ecology, 89(8): 2140-2153. DOI:10.1890/07-0992.1 |
Biederman J A, Scott R L, Bell T W, et al. 2017. CO2 exchange and evapotranspiration across dryland ecosystems of southwestern North America
[J]. Global Change Biology, 23(10): 4204-4221. DOI:10.1111/gcb.13686 |
Burba G G, McDermitt D K, Grelle A, et al. 2008. Addressing the influence of instrument surface heat exchange on the measurements of CO2 flux from open-path gas analyzers
[J]. Global Change Biology, 14(8): 1854-1876. DOI:10.1111/j.1365-2486.2008.01606.x |
Chen Z, Yu G R, Ge J P, et al. 2013. Temperature and precipitation control of the spatial variation of terrestrial ecosystem carbon exchange in the Asian region[J]. Agricultural and Forest Meteorology, 182–183: 266-276. DOI:10.1016/j.agrformet.2013.04.026 |
Dong G, Guo J X, Chen J Q, et al. 2011. Effects of spring drought on carbon sequestration, evapotranspiration and water use efficiency in the Songnen meadow steppe in northeast China[J]. Ecohydrology, 4(2): 211-224. DOI:10.1002/eco.200 |
Du Q, Liu H Z. 2013. Seven years of carbon dioxide exchange over a degraded grassland and a cropland with maize ecosystems in a semiarid area of China[J]. Agriculture, Ecosystems and Environment, 173: 1-12. DOI:10.1016/j.agee.2013.04.009 |
Falge E, Baldocchi D, Olson R, et al. 2001. Gap filling strategies for defensible annual sums of net ecosystem exchange[J]. Agricultural and Forest Meteorology, 107(1): 43-69. DOI:10.1016/S0168-1923(00)00225-2 |
Flanagan L B, Wever L A, Carlson P J. 2002. Seasonal and interannual variation in carbon dioxide exchange and carbon balance in a northern temperate grassland[J]. Global Change Biology, 8(7): 599-615. DOI:10.1046/j.1365-2486.2002.00491.x |
Fu Y L, Yu G R, Sun X M, et al. 2006. Depression of net ecosystem CO2 exchange in semi-arid Leymus chinensis steppe and alpine shrub
[J]. Agricultural and Forest Meteorology, 137(3–4): 234-244. DOI:10.1016/j.agrformet.2006.02.009 |
缑倩倩, 屈建军, 韩致文, 等. 2013. 西北干旱半干旱区生态系统碳循环研究进展[J]. 中国农学通报, 29(35): 205-210. Gou Q Q, Qu J J, Han Z W, et al. 2013. Progress of carbon cycle research in arid and semi-arid areas ecosystem of China[J]. Chinese Agricultural Science Bulletin, 29(35): 205-210. DOI:10.11924/j.issn.1000-6850.2013-0275 |
Guo Q, Hu Z M, Li S G, et al. 2012. Spatial variations in aboveground net primary productivity along a climate gradient in Eurasian temperate grassland: Effects of mean annual precipitation and its seasonal distribution[J]. Global Change Biology, 18(12): 3624-3631. DOI:10.1111/gcb.12010 |
郝彦宾, 王艳芬, 孙晓敏, 等. 2006. 内蒙古羊草草原碳交换季节变异及其生态学解析[J]. 中国科学(D辑: 地球科学), 49(S2): 186-195. Hao Y B, Wang Y F, Sun X M, et al. 2006. Seasonal variation in carbon exchange in and its ecological analysis over Leymus chinensis steppe in Inner Mongolia
[J]. Science in China (Ser. D: Earth Sciences), 49(S2): 186-195. DOI:10.1007/s11430-006-8186-5 |
Hao Y B, Wang Y F, Mei X R, et al. 2008. CO2, H2O and energy exchange of an Inner Mongolia steppe ecosystem during a dry and wet year
[J]. Acta Oecologica, 33(2): 133-143. DOI:10.1016/j.actao.2007.07.002 |
Hsu J S, Powell J, Adler P B. 2012. Sensitivity of mean annual primary production to precipitation[J]. Global Change Biology, 18(7): 2246-2255. DOI:10.1111/j.1365-2486.2012.02687.x |
黄耀, 孙文娟, 张稳, 等. 2010. 中国草地碳收支研究与展望[J]. 第四纪研究, 30(3): 456-465. Huang Y, Sun W J, Zhang W, et al. 2010. Study on carbon budget in grassland of China: Progress and perspectives[J]. Quaternary Sciences, 30(3): 456-465. DOI:10.3969/j.issn.1001-7410.2010.03.02 |
Hunt J E, Kelliher F M, McSeveny T M, et al. 2002. Evaporation and carbon dioxide exchange between the atmosphere and a tussock grassland during a summer drought[J]. Agricultural and Forest Meteorology, 111(1): 65-82. DOI:10.1016/S0168-1923(02)00006-0 |
姜纪峰, 延晓冬, 黄耀, 等. 2006. 半干旱区农田和草地与大气间二氧化碳和水热通量的模拟研究[J]. 气候与环境研究, 11(3): 413-424. Jiang J F, Yan X D, Huang Y, et al. 2006. Simulation of CO2 and sensible/latent heat fluxes exchange between land surface and atmosphere over cropland and grassland in semi-arid region
[J]. Climatic and Environmental Research, 11(3): 413-424. DOI:10.3878/j.issn.1006-9585.2006.03.19 |
Jin Z, Qi Y C, Dong Y S. 2007. Diurnal and seasonal dynamics of soil respiration in desert shrubland of Artemisia Ordosica on Ordos Plateau of Inner Mongolia, China
[J]. Journal of Forestry Research, 18(3): 231-235. DOI:10.1007/s11676-007-0047-3 |
Jing Y L, Wang A Z, Guan D X, et al. 2014. Carbon dioxide fluxes over a temperate meadow in eastern Inner Mongolia, China[J]. Environmental Earth Sciences, 72(11): 4401-4411. DOI:10.1007/s12665-014-3341-3 |
Kim J, Verma S B. 1990. Carbon dioxide exchange in a temperate grassland ecosystem[J]. Bound.-Layer Meteor., 52(1–2): 135-149. DOI:10.1007/BF00123181 |
Knapp A K, Fay P A, Blair J M, et al. 2002. Rainfall variability, carbon cycling, and plant species diversity in a mesic grassland[J]. Science, 298(5601): 2202-2205. DOI:10.1126/science.1076347 |
Li S G, Lai C T, Yokoyama T, et al. 2003. Carbon dioxide and water vapor exchange over a Miscanthus-type grassland: Effects of development of the canopy
[J]. Ecological Research, 18(6): 661-675. DOI:10.1111/j.1440-1703.2003.00587.x |
Li S G, Asanuma J, Eugster W, et al. 2005. Net ecosystem carbon dioxide exchange over grazed steppe in central Mongolia[J]. Global Change Biology, 11(11): 1941-1955. DOI:10.1111/j.1365-2486.2005.01047.x |
李琪, 王云龙, 胡正华, 等. 2010. 基于涡度相关法的中国草地生态系统碳通量研究进展[J]. 草业科学, 27(12): 38-44. Li Q, Wang Y L, Hu Z H, et al. 2010. Research progress on carbon flux of grassland ecosystem based on the eddy covariance method in China[J]. Pratacultural Science, 27(12): 38-44. DOI:10.3969/j.issn.1001-0629.2010.12.007 |
Li G Y, Han H Y, Du Y, et al. 2017. Effects of warming and increased precipitation on net ecosystem productivity: A long-term manipulative experiment in a semiarid grassland[J]. Agricultural and Forest Meteorology, 232: 359-366. DOI:10.1016/j.agrformet.2016.09.004 |
Niu S L, Wu M Y, Han Y, et al. 2008. Water-mediated responses of ecosystem carbon fluxes to climatic change in a temperate steppe[J]. New Phytologist, 177(1): 209-219. DOI:10.1111/j.1469-8137.2007.02237.x |
Papale D, Reichstein M, Aubinet M, et al. 2006. Towards a standardized processing of Net Ecosystem Exchange measured with eddy covariance technique: Algorithms and uncertainty estimation[J]. Biogeosciences, 3(4): 571-583. DOI:10.5194/bg-3-571-2006 |
Paruelo J M, Lauenroth W K, Burke I C, et al. 1999. Grassland precipitation-use efficiency varies across a resource gradient[J]. Ecosystems, 2(1): 64-68. DOI:10.1007/s100219900058 |
彭琴, 齐玉春, 董云社, 等. 2012. 干旱半干旱地区草地碳循环关键过程对降雨变化的响应[J]. 地理科学进展, 31(11): 1510-1518. Peng Q, Qi Y C, Dong Y S, et al. 2012. Responses of carbon cycling key processes to precipitation changes in arid and semiarid grassland ecosystems: A review[J]. Progress in Geography, 31(11): 1510-1518. DOI:10.11820/dlkxjz.2012.11.012 |
朴世龙, 方精云, 黄耀. 2010. 中国陆地生态系统碳收支[J]. 中国基础科学, 12(2): 20-22. Piao S L, Fang J Y, Huang Y. 2010. The carbon balance of terrestrial ecosystems in China[J]. China Basic Science, 12(2): 20-22. DOI:10.3969/j.issn.1009-2412.2010.02.006 |
Qi J G, Chen J Q, Wan S Q, et al. 2012. Understanding the coupled natural and human systems in Dryland East Asia[J]. Environmental Research Letters, 7(1): 015202. DOI:10.1088/1748-9326/7/1/015202 |
Qin F Y, Jia G S, Yang J, et al. 2018. Spatiotemporal variability of precipitation during 1961–2014 across the Mongolian Plateau[J]. Journal of Mountain Science, 15(5): 992-1005. DOI:10.1007/s11629-018-4837-1 |
Shao C L, Chen J Q, Chu H S, et al. 2017. Grassland productivity and carbon sequestration in Mongolian grasslands: The underlying mechanisms and nomadic implications[J]. Environmental Research, 159: 124-134. DOI:10.1016/j.envres.2017.08.001 |
Sun S, Xing F, Zhao H, et al. 2014. Response of bacterial community to simulated nitrogen deposition in soils and a unique relationship between plant species and soil bacteria in the Songnen grassland in Northeastern China[J]. Journal of Soil Science and Plant Nutrition, 140(3): 565-580. DOI:10.4067/S0718-95162014005000045 |
Vervaet H, Massart B, Boeckx P, et al. 2002. Use of principal component analysis to assess factors controlling net N mineralization in deciduous and coniferous forest soils[J]. Biol. Fertil. Soils, 36: 101. DOI:10.1007/s00374-002-0512-2 |
Vickers D, Mahrt L. 1997. Quality control and flux sampling problems for tower and aircraft data[J]. J. Atmos. Oceanic Technol., 14(3): 512-526. DOI:10.1175/1520-0426(1997)014<0512:QCAFSP>2.0.CO;2 |
汪文雅, 郭建侠, 王英舜, 等. 2015. 锡林浩特草原CO2通量特征及其影响因素分析
[J]. 气象科学, 35(1): 100-107. Wang W Y, Guo J X, Wang Y S, et al. 2015. Observing characteristics of CO2 flux and its influencing factors over Xilinhot grassland
[J]. Journal of the Meteorological Science, 35(1): 100-107. DOI:10.3969/2013jms.0065 |
王玉辉, 井长青, 白洁, 等. 2014. 亚洲中部干旱区3个典型生态系统生长季水碳通量特征[J]. 植物生态学报, 38(8): 785-808. Wang Y H, Jing C Q, Bai J, et al. 2014. Characteristics of water and carbon fluxes during growing season in three typical arid ecosystems in central Asia[J]. Chinese Journal of Plant Ecology, 38(8): 785-808. DOI:10.3724/SP.J.1258.2014.00075 |
Webb E K, Pearman G I, Leuning R. 1980. Correction of flux measurements for density effects due to heat and water vapour transfer[J]. Quart. J. Roy. Meteor. Soc., 106(447): 85-100. DOI:10.1002/qj.49710644707 |
Wesche K, Ambarlı D, Kamp J, et al. 2016. The Palaearctic steppe biome: A new synthesis[J]. Biodiversity and Conservation, 25(12): 2197-2231. DOI:10.1007/s10531-016-1214-7 |
White R, Murray S, Rohweder M. 2000. Pilot Analysis of Global Ecosystems: Grassland Ecosystems [M]. Washington DC: World Resources Institute, 69pp.
|
Whitley R J, Macinnis-Ng C M O, Hutley L B, et al. 2011. Is productivity of mesic savannas light limited or water limited? Results of a simulation study[J]. Global Change Biology, 17(10): 3130-3149. DOI:10.1111/j.1365-2486.2011.02425.x |
Wilczak J M, Oncley S P, Stage S A. 2001. Sonic anemometer tilt correction algorithms[J]. Bound.-Layer Meteor., 99(1): 127-150. DOI:10.1023/A:1018966204465 |
Wu Z T, Dijkstra P, Koch G W, et al. 2011. Responses of terrestrial ecosystems to temperature and precipitation change: A meta-analysis of experimental manipulation[J]. Global Change Biology, 17(2): 927-942. DOI:10.1111/j.1365-2486.2010.02302.x |
薛红喜, 李琪, 王云龙, 等. 2009. 克氏针茅草原生态系统生长季碳通量变化特征[J]. 农业环境科学学报, 28(8): 1742-1747. Xue H X, Li Q, Wang Y L, et al. 2009. Variation of net ecosystem carbon flux exchange over Stipa krylovii steppe in the growing season
[J]. Journal of Agro-Environment Science, 28(8): 1742-1747. DOI:10.3321/j.issn:1672-2043.2009.08.033 |
赵康, 宝音陶格涛. 2014. 季节性放牧利用对典型草原群落生产力的影响[J]. 中国草地学报, 36(1): 109-115. Zhao K, Baoyin T. 2014. Effect of seasonal grazing use on productivity of grassland community[J]. Chinese Journal of Grassland, 36(1): 109-115. DOI:10.3969/j.issn.1673-5021.2014.01.021 |
Zhao H C, Jia G S, Wang H S, et al. 2019. Seasonal and interannual variations in carbon fluxes in East Asia semi-arid grasslands[J]. Science of the Total Environment, 668: 1128-1138. DOI:10.1016/j.scitotenv.2019.02.378 |
 2020, Vol. 25


