State Key Laboratory of Numerical Modeling for Atmospheric Sciences and Geophysical Fluid Dynamics, Institute of Atmospheric Physics, Chinese Academy of Sciences, Beijing 100029
2.
University of Chinese Academy of Science, Beijing 100049
Funded by:National Key Research and Development Program of China (Grant 2018YFA0606203), Strategic Priority Research Program of Chinese Academy of Sciences (Grant XDA20100304)
图 1 地理上中国东北地区(包括辽宁省、吉林省、黑龙江省、内蒙古自治区东部和河北省的东北部)站点分布。我们选取了无缺测且经过质量控制的108个台站 Figure 1 Geographical map of Northeast China including the Liaoning Province, Jilin Province, Heilongjiang Province, eastern part of Inner Mongolia Autonomous region, and northeastern part of Hebei Province. We selected 108 qualified stations without missing measement
IPCC第四次评估报告将极端天气事件定义为一特定时间和地点发生概率极小的事件,通常发生概率只占该类天气现象的10%或者更低(Cruz et al., 2007)。极端高温事件作为一种小概率事件,其引发的高温热浪天气得到了广泛的国际关注和讨论,然而,国际上对于高温热浪天气的研究并没有一个统一的方法。我国气象局规定日最高温度(Tmax)大于或等于35℃为高温日,连续3天以上即可定义为一次高温事件,但由于中国地域辽阔,东北地区又处在中高纬,常年气温偏低,故不能以此标准来做研究。为此,本文引用超热因子(Excess Heat Factor,EHF)来做研究,该因子由Perkins et al.(2012)设计,并从该因子推导出多个热浪指数来描述热浪天气特征,得到了国外其它学者的应用(肖安和周长艳, 2017)。
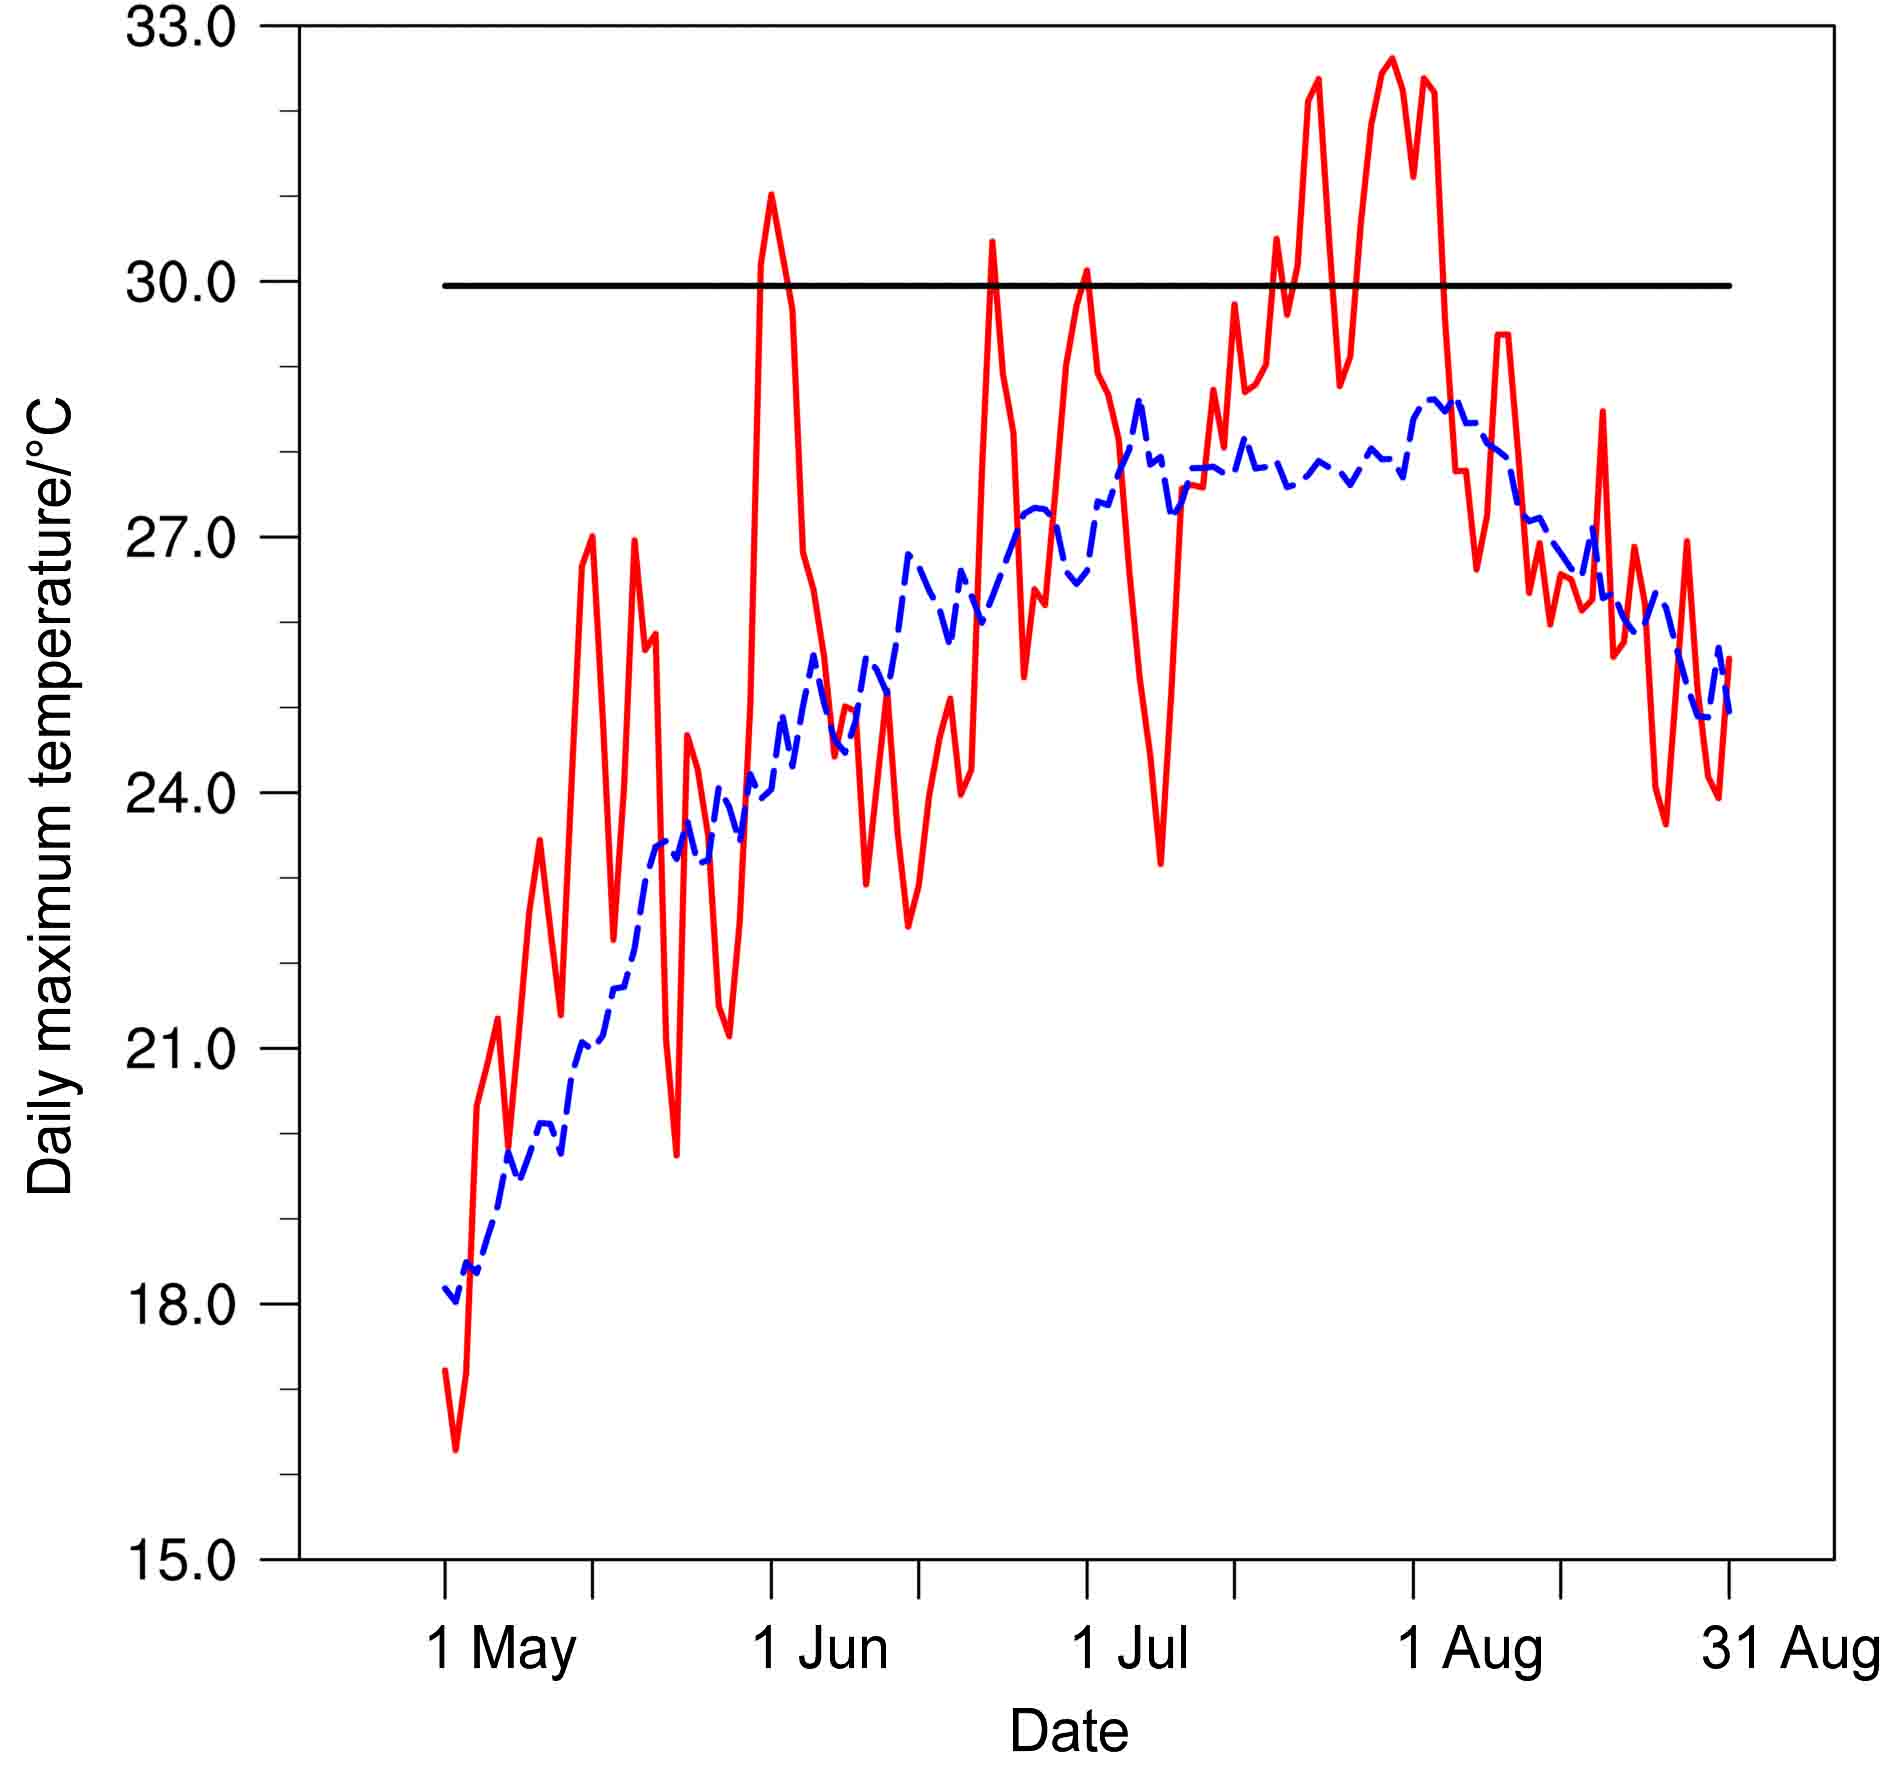
图 2 2018年5~8月东北地区全区日最高温度时间序列(红线)。蓝线表示东北地区1971~2017年同时段气候态;黑线表示30℃线(本文选取的东北地区极端高温阈值) Figure 2 Daily maximum temperature time series (red line) in Northeast China from May to August 2018. The blue line indicates the climatic state time series between May and August from 1971 to 2017 in Northeast China; black line represents the 30℃ line, which is defined as the extreme high temperature threshold in Northeast China
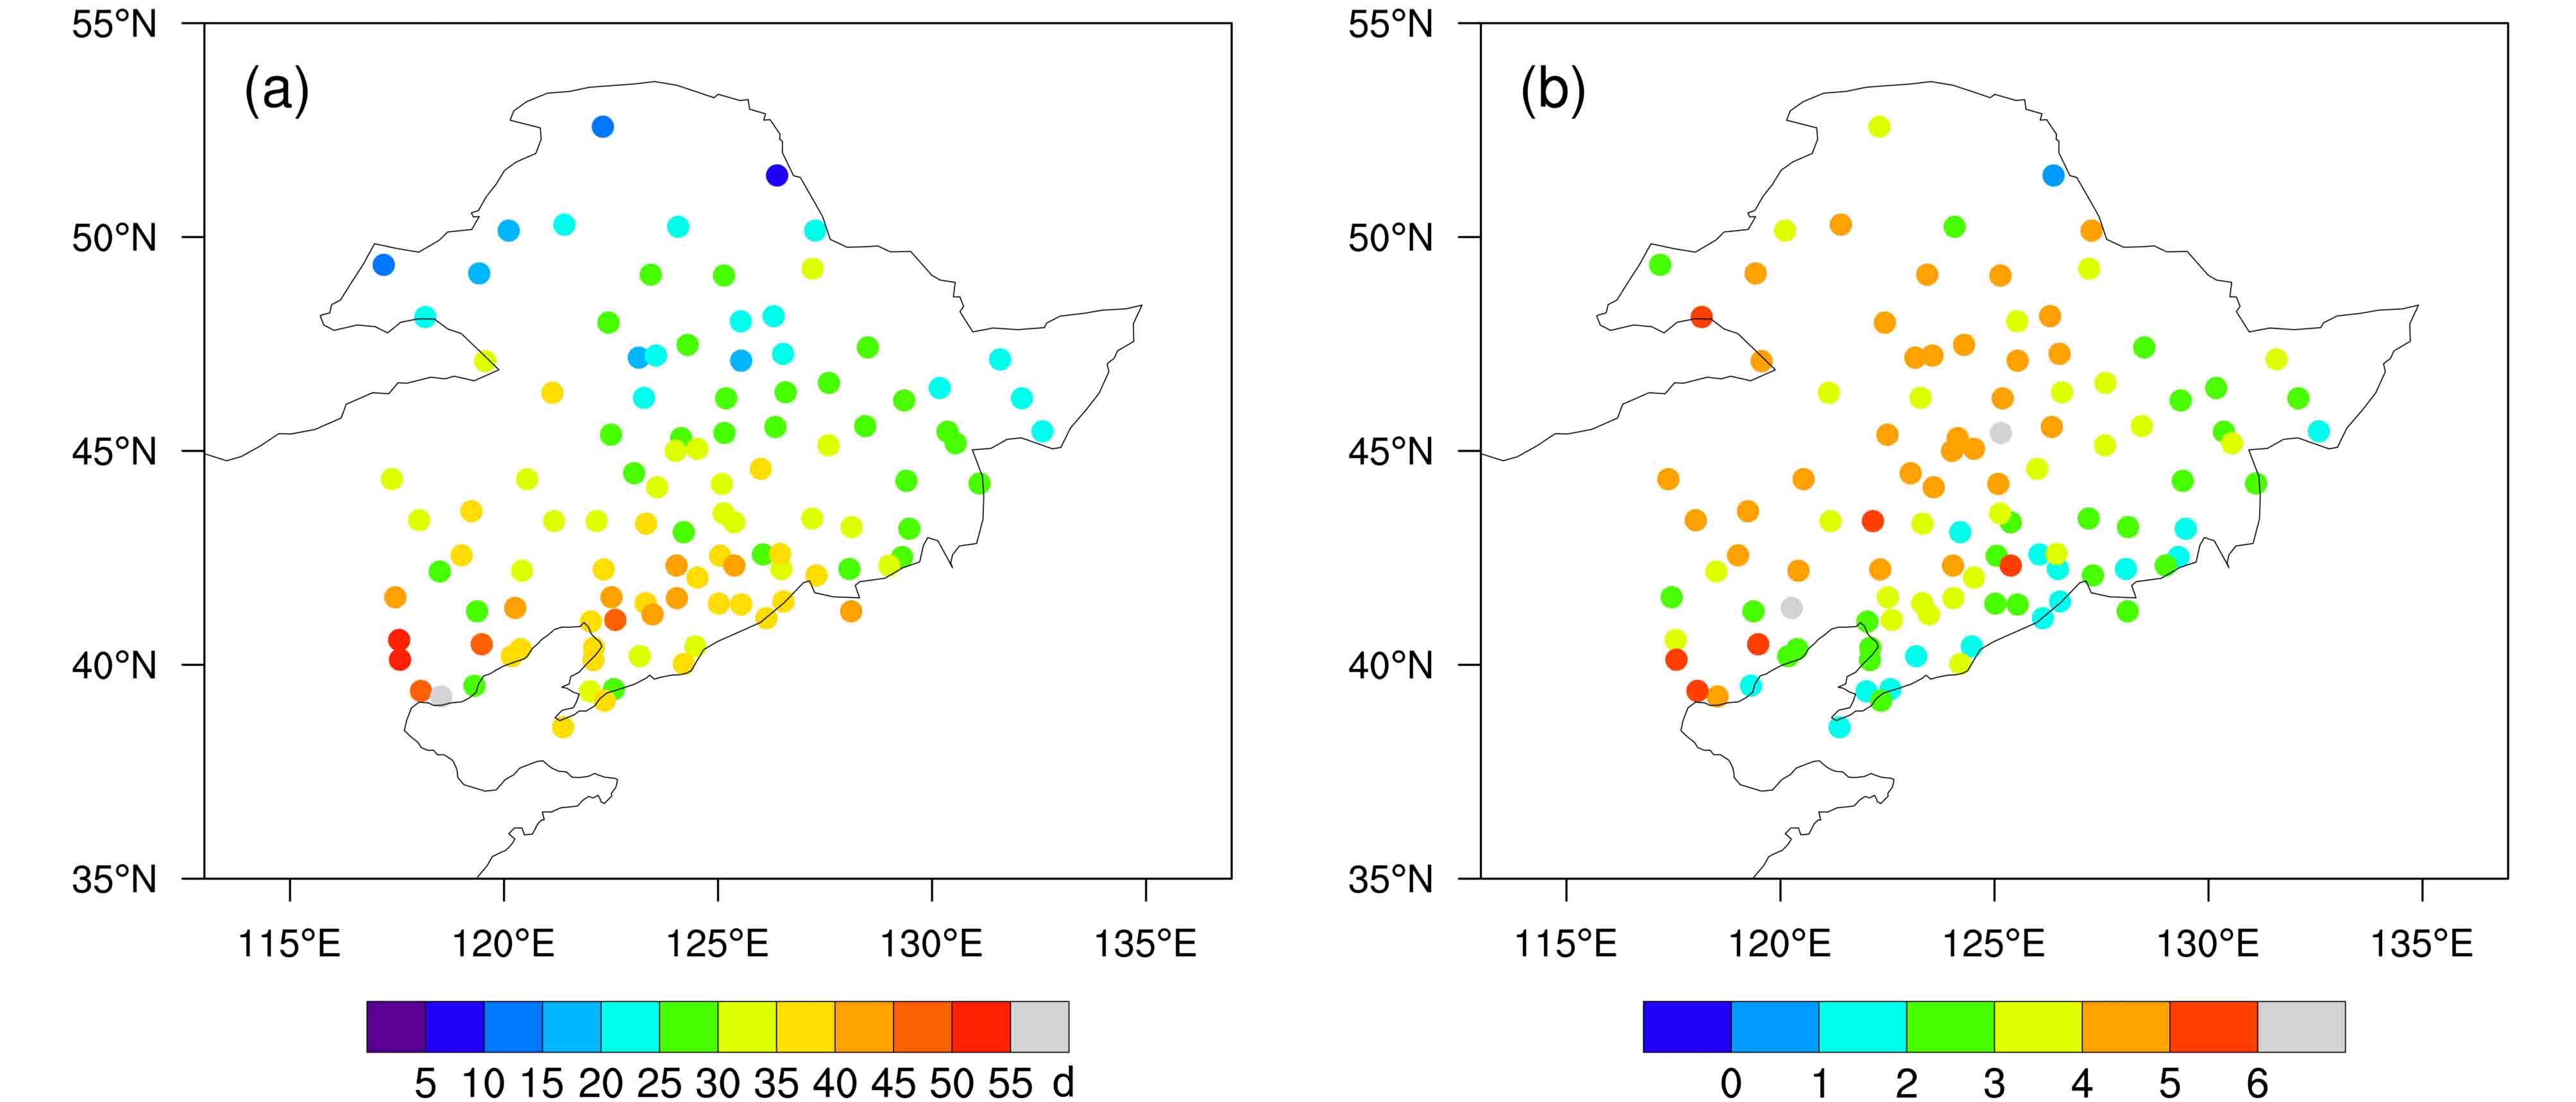
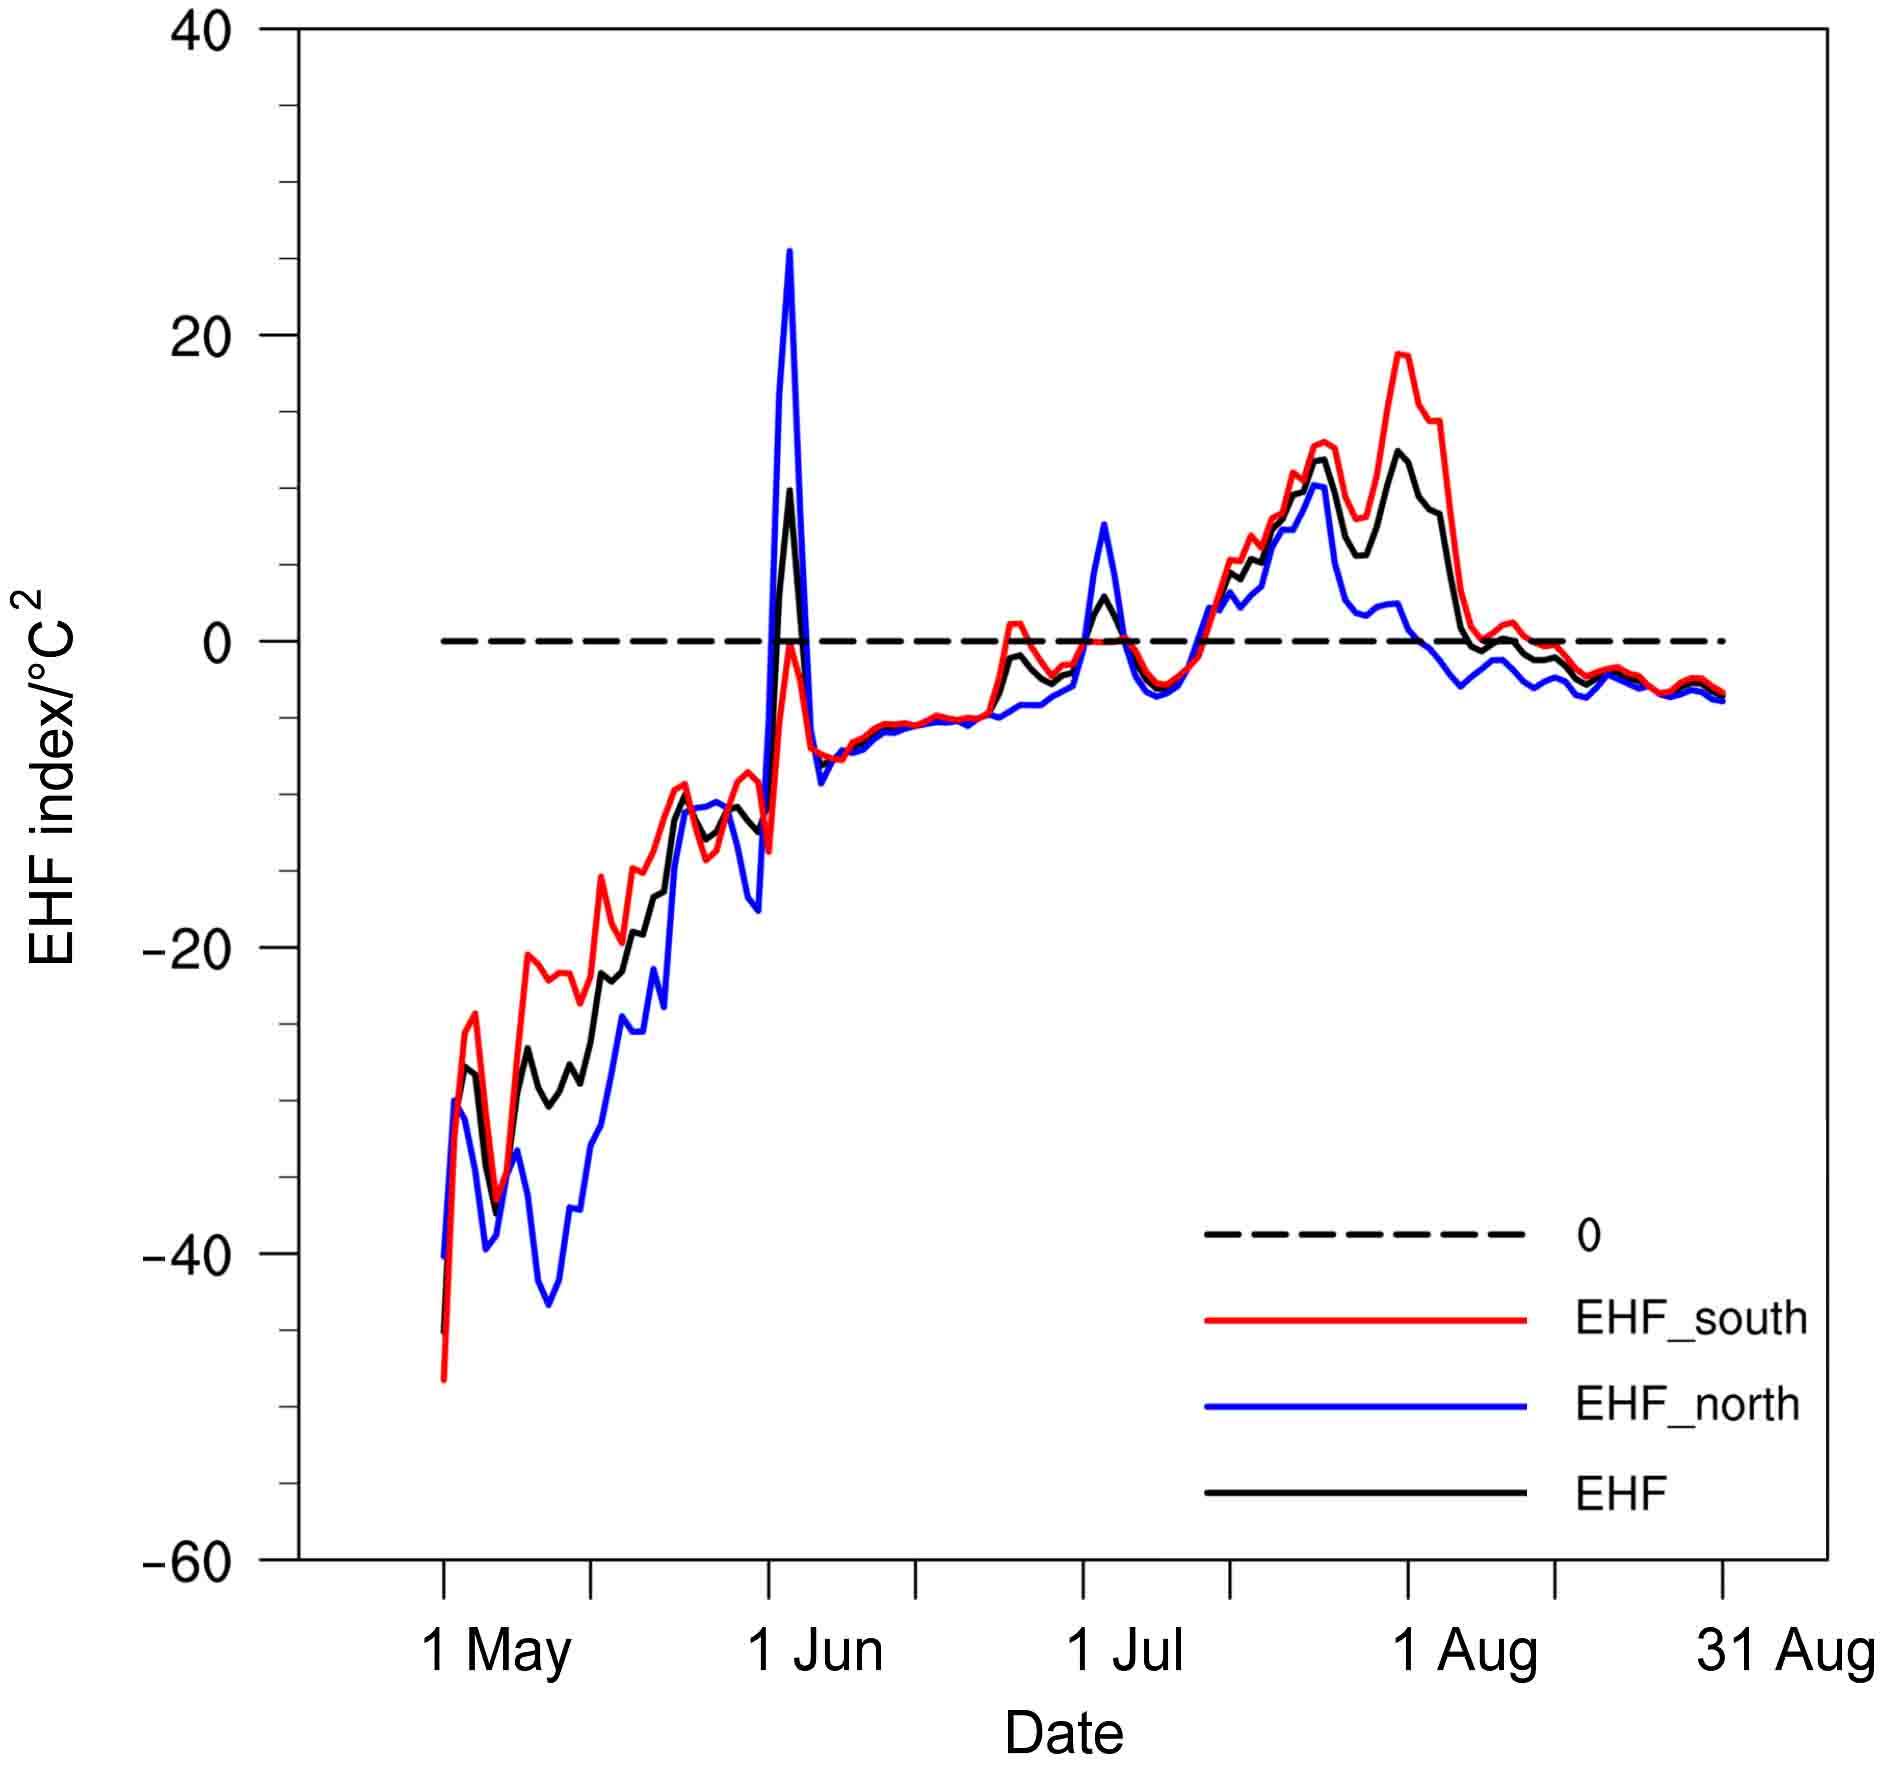
为统计2018年夏季5~8月,东北全区108个站发生的高温日数和高温过程数,本文采用超热因子EHF来进行判断。超热因子EHF由Perkins et al.(2012)设计,定义超热因子EHF>0即为高温日,连续3天超热因子EHF>0的时候,则定为发生了一次高温热浪,且依据EHF指数的计算方法,可以得知当某一台站EHF>0时,说明该站当日及前后两日的日平均气温超过了该站从1971~2017年的长期气候态的极端高温阈值。图3a和图3b给出了东北地区5~8月发生的高温日数和高温过程数的分布情况。由图3a可看出,这个夏季最热的地区集中在东北南部(45°N以南),该地区的观测台站出现高温天气的日数基本均在30天以上,部分台站的高温日数甚至超过50天,仅有少数台站的高温日数在25~30天;与之相比,东北北部(45°N以北)观测台站在整个夏季的高温日数偏少,绝大多数台站的高温日数集中在20~30天这一区间,有极个别台站在整个夏季的高温日数不足10天。而从图3b中可以发现,东北北部的台站整个夏季发生的高温过程数较多,而东北南部的台站发生的高温过程数偏少,特别是靠近40°N位置的台站,整个夏季经历的高温过程数不足3次。结合图3a和图3b不难看出,2018年夏季东北全区发生高温异常有明显的空间分布差异,具体表现在东北南部站点经历的高温异常日数明显偏多,经历的高温过程次数少但持续时间长。而东北北部站点经历的高温异常日数偏少,经历的高温过程次数偏多,但每一次高温过程的持续时间短暂。考虑到图2给出的结果,我们可以推测,东北地区发生极端高温的事件集中在2018年7月份之后,发生高温显著异常的区域在东北南部。为验证这一结果,我们计算了整个夏季东北全区,东北南部及东北北部的EHF指数序列,如图4所示。不难看出,尽管6月份前期东北地区经历了短暂的高温,且高温主要发生在东北北部,东北北部的EHF指数正值突出,但是持续时间很短暂,而在进入7月份之后,东北南部地区的EHF指数得到显著增强,基本处在正值很高的水平,这说明东北南部在7月份之后,经历了漫长的高温过程,这再一次印证了前面的分析结果。
图 3
图 3 2018年5~8月东北地区每个台站发生的(a)高温日数和(b)高温过程数(高温日连续3天以上就定为一个高温过程) Figure 3 (a) High temperature days and (b) high temperature processes occurring at each station in Northeast China from May to August 2018. There are more than three continuous high temperature days during each high temperature process
图 4 2018年5~8月东北全区(黑实线)、东北北部(蓝实线)、东北南部地区(红实线)的超热因子(EHF,单位:℃2)指数的时间序列
Figure 4 Excess heat factor (℃2) index time series in Northeast China (solid black line), northern part of Northeast China (solid blue line), and southern part of Northeast China (solid red line) from May to August 2018
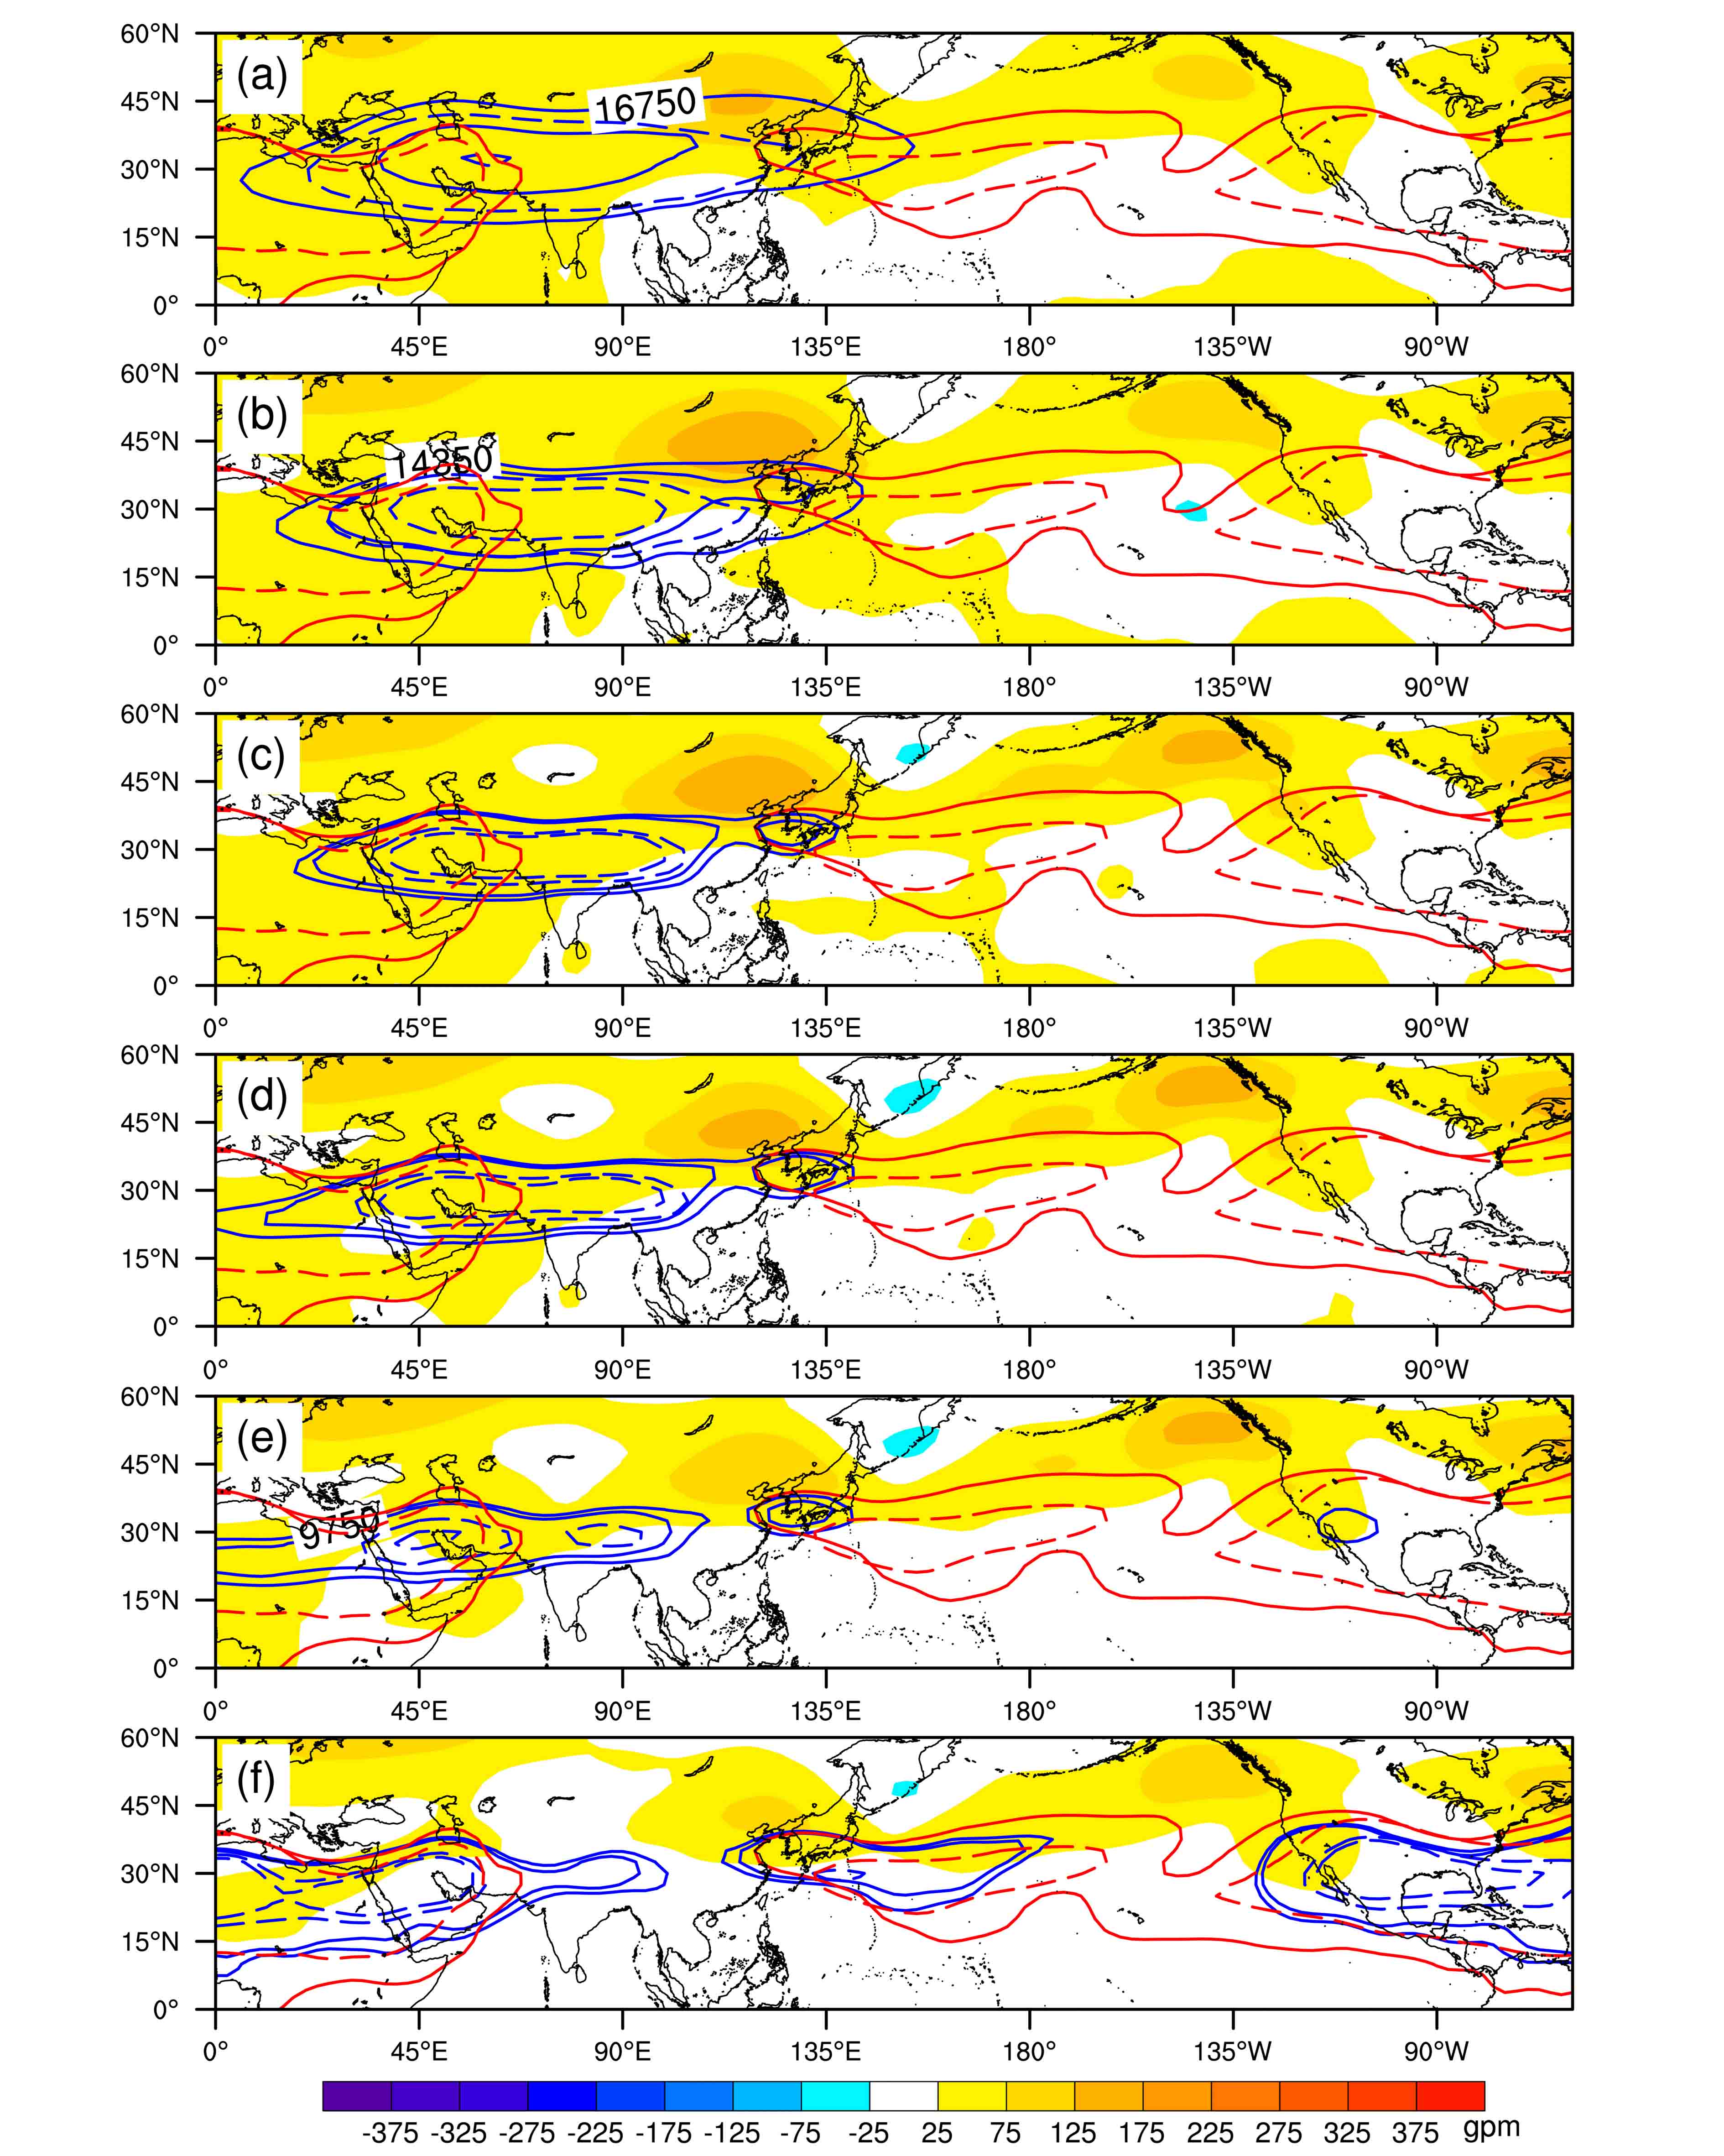
图 5 2018年7月8日至8月31日平均南亚高压特征线(蓝实线)、位势高度异常(填色,单位:gpm)和同期气候平均(1971~2017年)南亚高压特征线(蓝色虚线):(a)100 hPa;(b)150 hPa;(c)200 hPa、;(d)250 hPa;(e)300 hPa;(f)400 hPa。红色实线和红色虚线分别表示同期和同期气候平均(1971~2017年)500 hPa西太平洋副热带高压特征线 Figure 5 Boundary lines of the South Asia high (SAH) (solid blue lines), geopotential height anomalies (shaded, units: gpm) from 8 July to 31 August 2018, and climatological (1971–2017) boundary lines of the SAH from 8 July to 31 August (blue dotted lines): (a) 100 hPa; (b) 150 hPa; (c) 200 hPa; (d) 250 hPa, (e) 300 hPa; (f) 400 hPa. The solid red lines represent the western Pacific subtropical high (WPSH) boundary lines at 500 hPa, and red dotted lines represent the climatological (1971–2017) boundary lines of the WPSH at 500 hPa from 8 July to 31 August
图 6 2018年7月8日至8月31日平均沿(a)35°N、(b)37.5°N、(c)40°N、(d)42.5°N、(e)45°N、(f)47.5°N的涡度异常纬向—垂直剖面(单位:
${10^{{\rm{ - }}5}}{{\rm{s}}^{ - 1}}$
)。红色矩形区域内代表东北南部地区上空300~500 hPa
Figure 6 Longitudinal–vertical sections of vorticity anomalies (
${10^{{\rm{ - }}5}}{{\rm{s}}^{ - 1}}$
) along (a) 35°N, (b) 37.5°N, (c) 40°N, (d) 42.5°N, (e) 45°N, and (f) 47.5°N from 8 July to 31 August 2018. The area of the red rectangular frame represents the geopotential height of 300–500 hPa over the southern region of Northeast China
图 7 2018年4月30日至9月30日东北南部(37.5°N~47.5°N,120°E~130°E)(a)涡度异常(阴影区,单位:10−5 s−1)和(b)垂直风场异常(阴影区,单位:10−2 Pa s−1)时间序列
Figure 7 Time series of (a) vorticity anomalies (10−5 s−1) and (b) vertical wind field anomalies (10−2 Pa s−1) in the southern part of Northeast China (37.5°N–47.5°N, 120°E–130°E) from 30 April to 30 September 2018
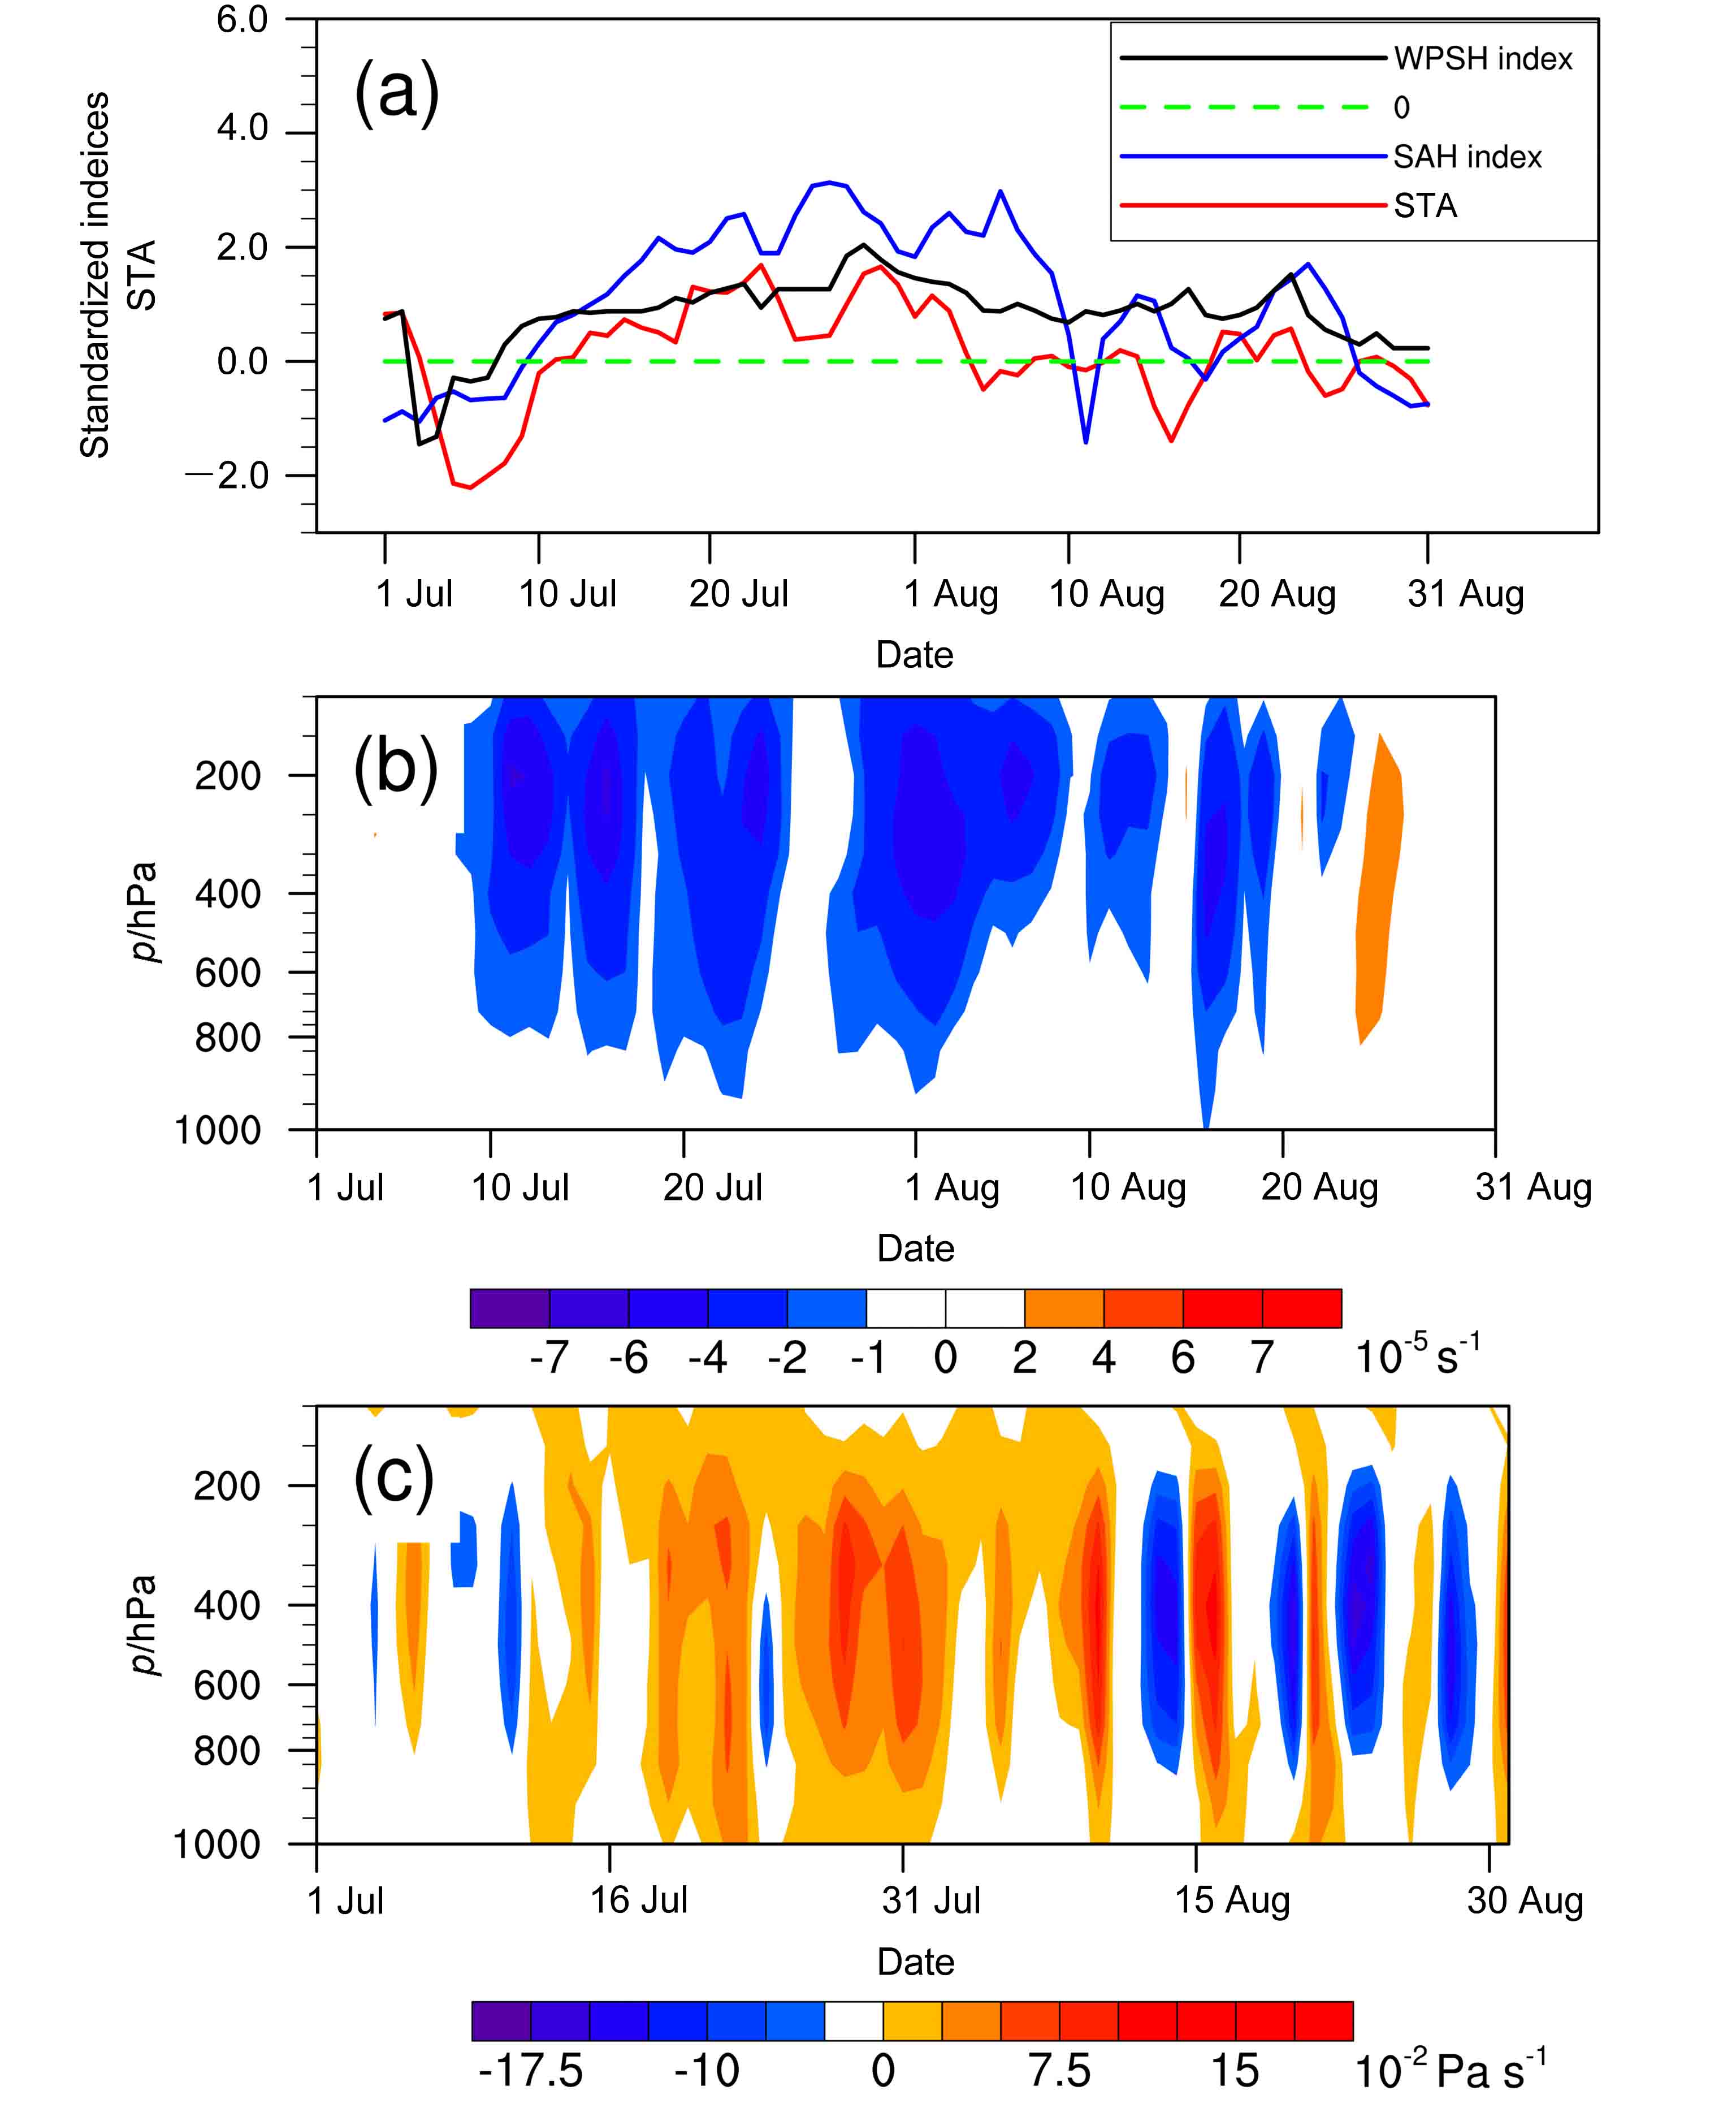
图 8 (a)2018年7~8月东北南部区域平均温度异常(红线)、西太平洋副热带高压脊线(黑线)和南亚高压指数(蓝线)标准化后的时间序列;2018年7~8月东北南部区域平均(b)涡度异常(单位:10−5 s−1)和(c)垂直风场异常(单位:10−2 Pa s−1)高度—时间序列
Figure 8 (a) Time series of standardized temperature anomalies (STA) in the southern part of Northeast China (red line), standardized WPSH ridge line (black line), and standardized SAH index (blue line) from July to August 2018; time–height series of (b) vorticity anomalies (10−5 s−1) and (c) vertical wind field anomalies (10−2 Pa s−1) in the southern region of Northeast China from July to August 2018
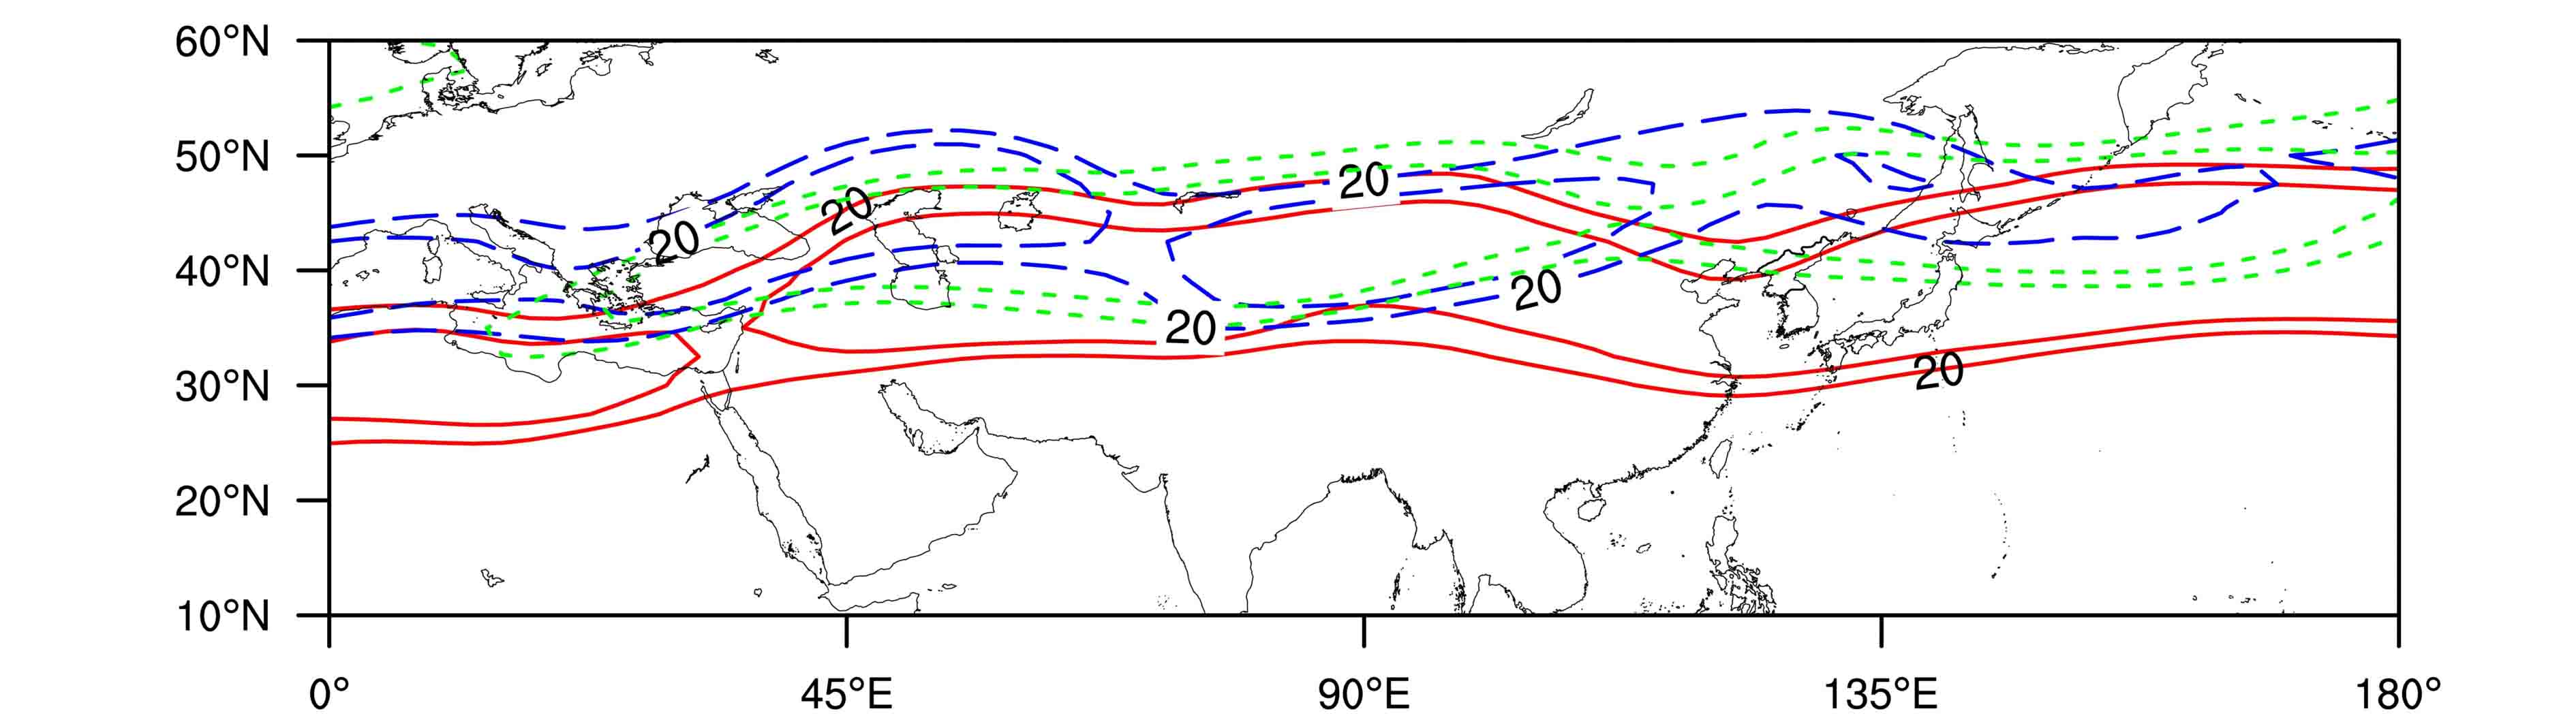
前人的研究成果表明:亚洲西风急流是北半球夏季准定常Rossby波的波导(Ambrizzi et al., 1995),西风急流中准定常Rossby 波的活动和其能量传播对东亚的天气气候变化有着重要影响(Liang et al., 1998; Lu et al., 2002)。而准定常Rossby波沿亚洲急流向东传播到日本及以东地区,有可能导致西太平洋副热带高压在日本上空增强(Park and Schubert, 1997; Enomoto et al., 2003; Enomoto et al., 2004)。从夏季200 hPa纬向风20 m/s和25 m/s等风速线位置(图9),可以明显看出副热带西风急流的位置变动:2018年6月,西风急流的平均位置在36°N左右,其中30°E~180°E的西风急流位置略北,在38°N左右。到7月,整体西风急流的平均位置北跃到40°N以北,其中30°E~60°E的西风急流平均位置偏南,60°E~180°E的西风急流平均位置偏北,副热带西风急流位置略呈东北—西南走向。到了8月,西风急流的位置继续维持偏北态势,其平均位置已达42.5°N,急流中心分别存在于北非与西亚的交界处,地中海、黑海、里海的上空和贝加尔湖以南的蒙古高原上空。东亚地区上空的副热带西风急流在7月明显北跳,在8月份继续维持偏北态势,这应该是与西太平洋副热带高压在7月初发生北跳继而持续偏北紧密相连,但同时也为7、8月副热带西风急流中Rossby波活动的位置偏北创造了有利条件。
图 9
图 9 2018年夏季200 hPa纬向风20 m/s和25 m/s等风速线的位置(红线代表6月,绿线代表7月,蓝线代表8月) Figure 9 Positions of equal wind lines for zonal winds of 20 m/s and 25 m/s at a geopotential height at 200 hPa during the summer of 2018. The red line represents June, green line represents July, and blue line represents August
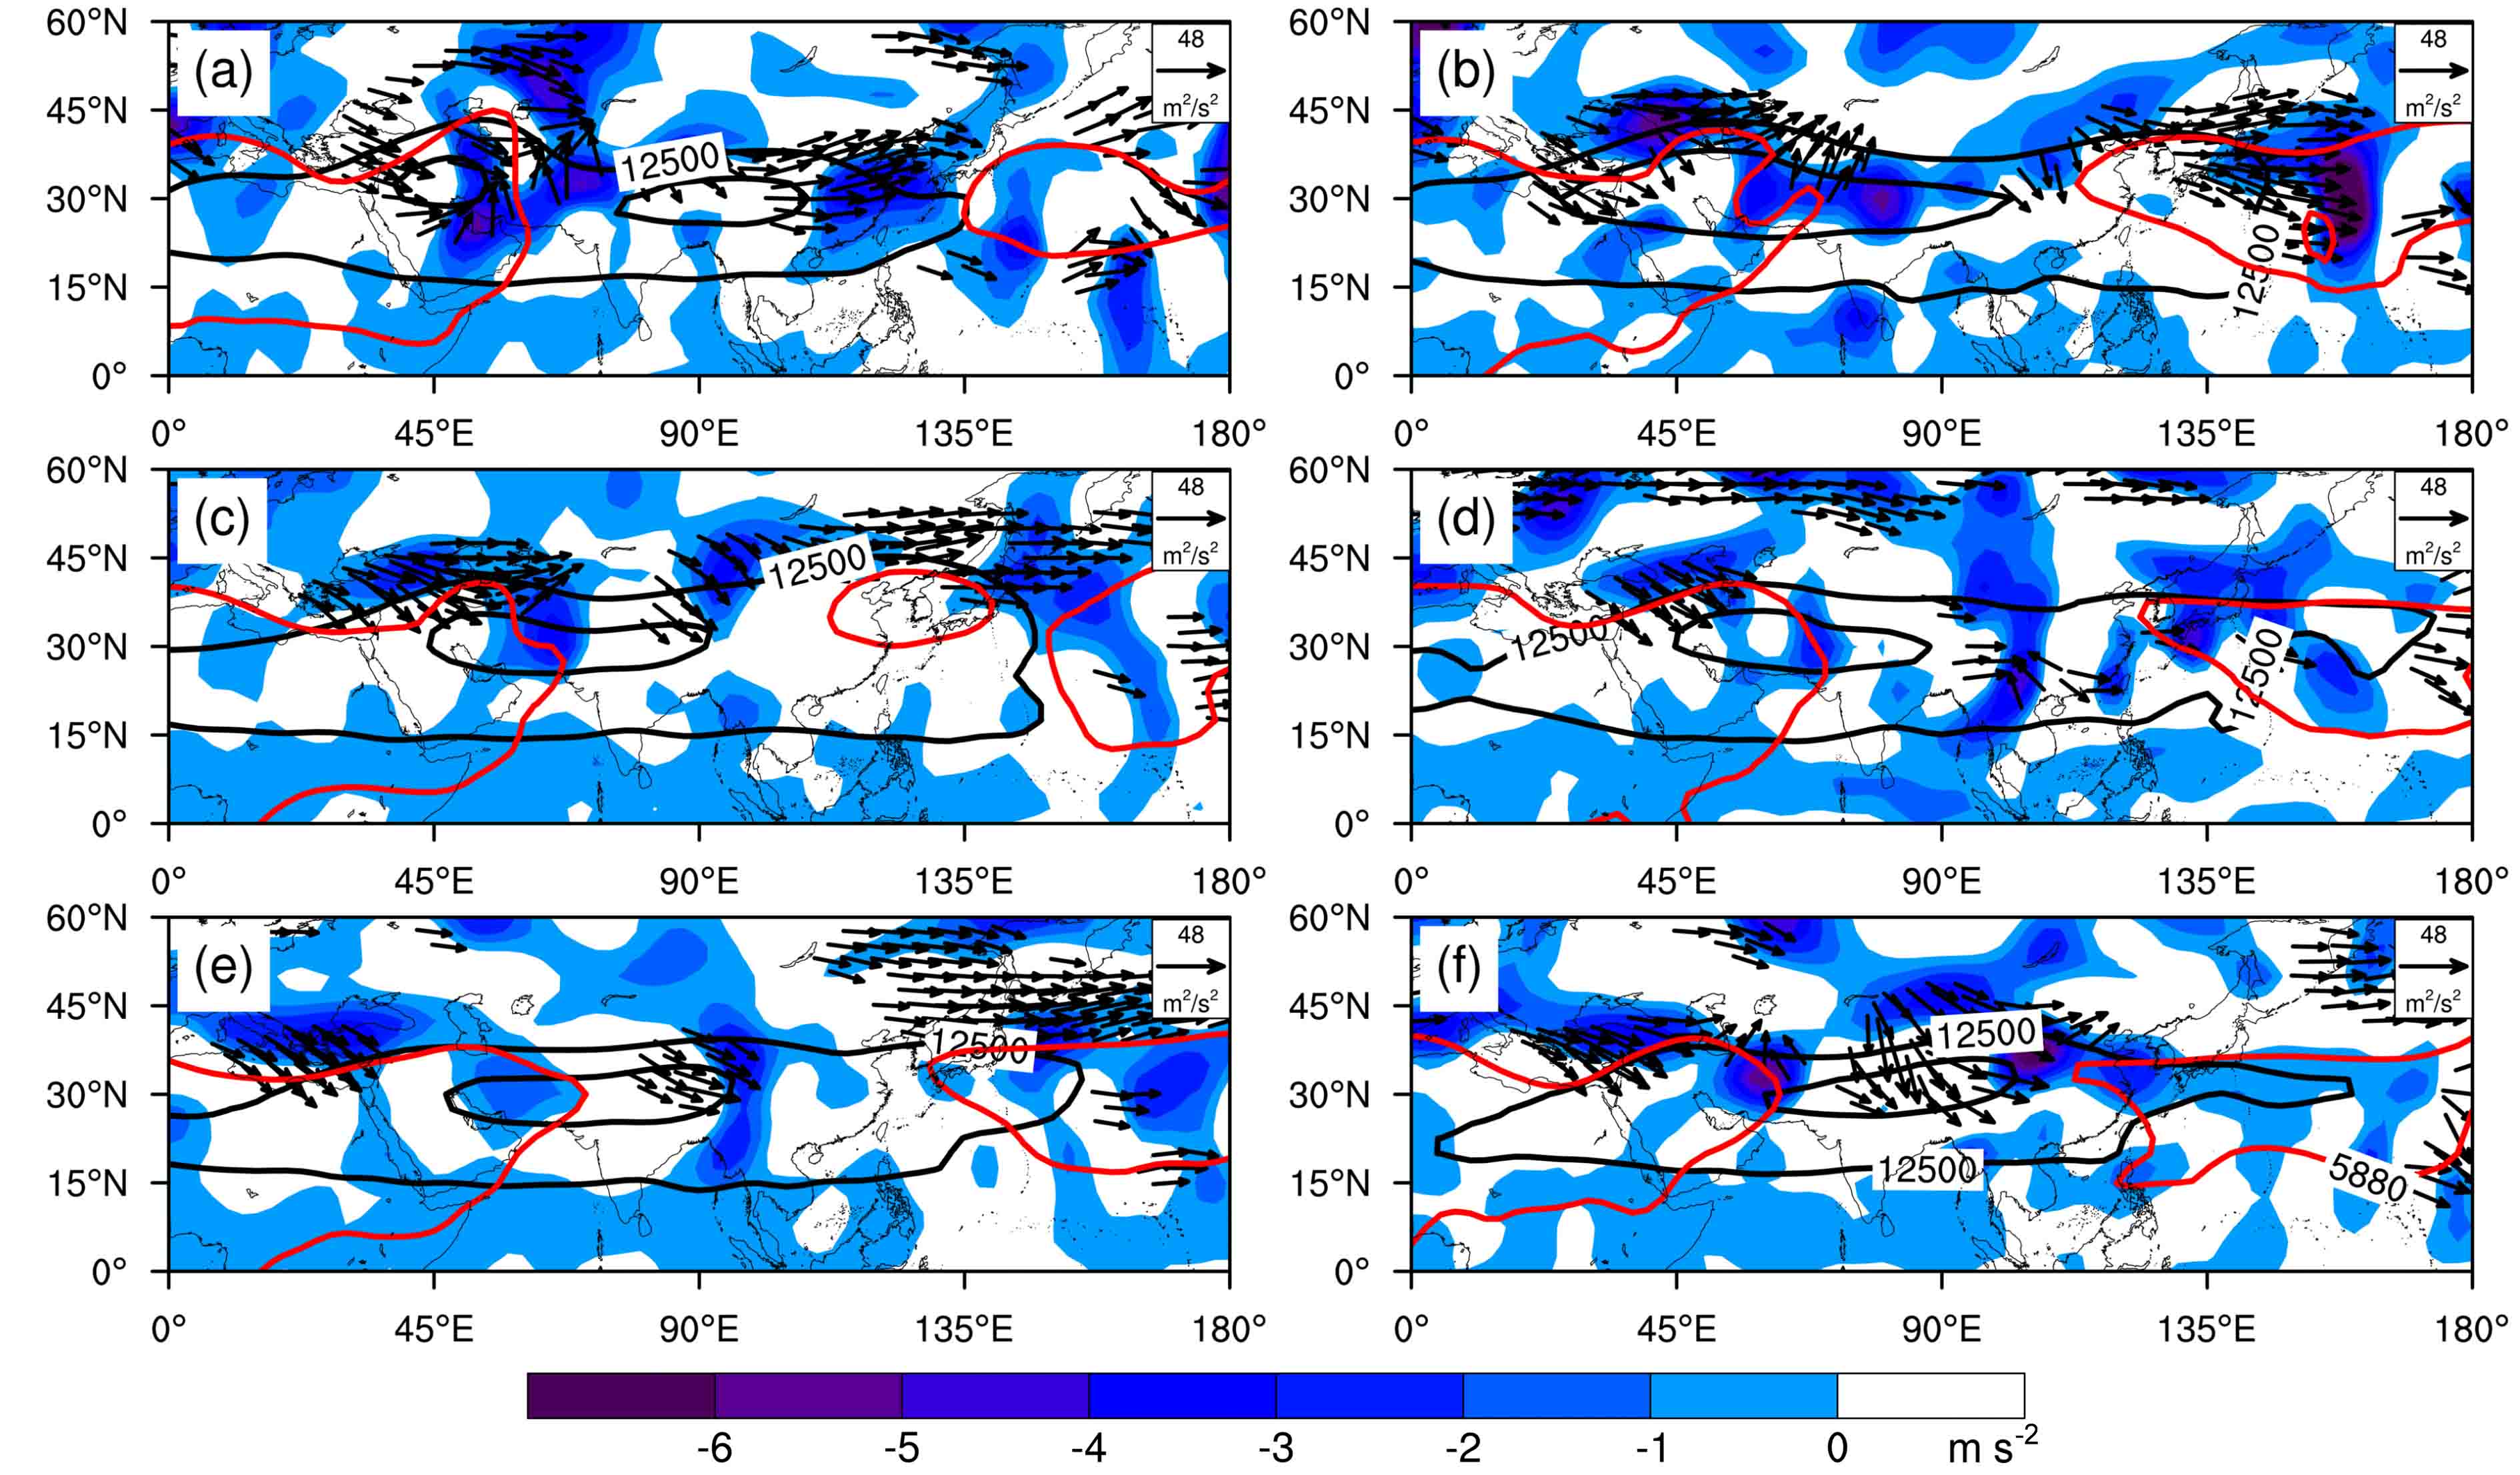
图 10 2018年7~8月6个时段平均200 hPa水平波活动作用通量(黑色矢量箭头,单位:m2/s2,未画出小于20 m2/s2的水平波活动矢量)和水平波活动通量散度场(填色,单位:m
${{\rm{s}}^{ - 2}}$
):(a)2018年7月1~8日;(b)2018年7月9~15日;(c)2018年7月16日至8月9日;(d)2018年8月10~13日;(e)2018年8月14~26日;(f)2018年8月27~31日
Figure 10 200-hPa horizontal wave activity fluxes (black vector arrow, units: m2/s2, and the horizontal wave activity fluxes less than 20 m2/s2 are not drawn) and horizontal wave active flux divergence fields (shaded, units: m
${{\rm{s}}^{ - 2}}$
) averaged for the six periods from July to August 2018: (a) From 1 to 8 July; (b) from 09 to 15 July; (c) from 16 July to 09 August; (d) from 10 to 13 August; (e) from 14 to 26 August; (f) from 27 to 31 August 2018
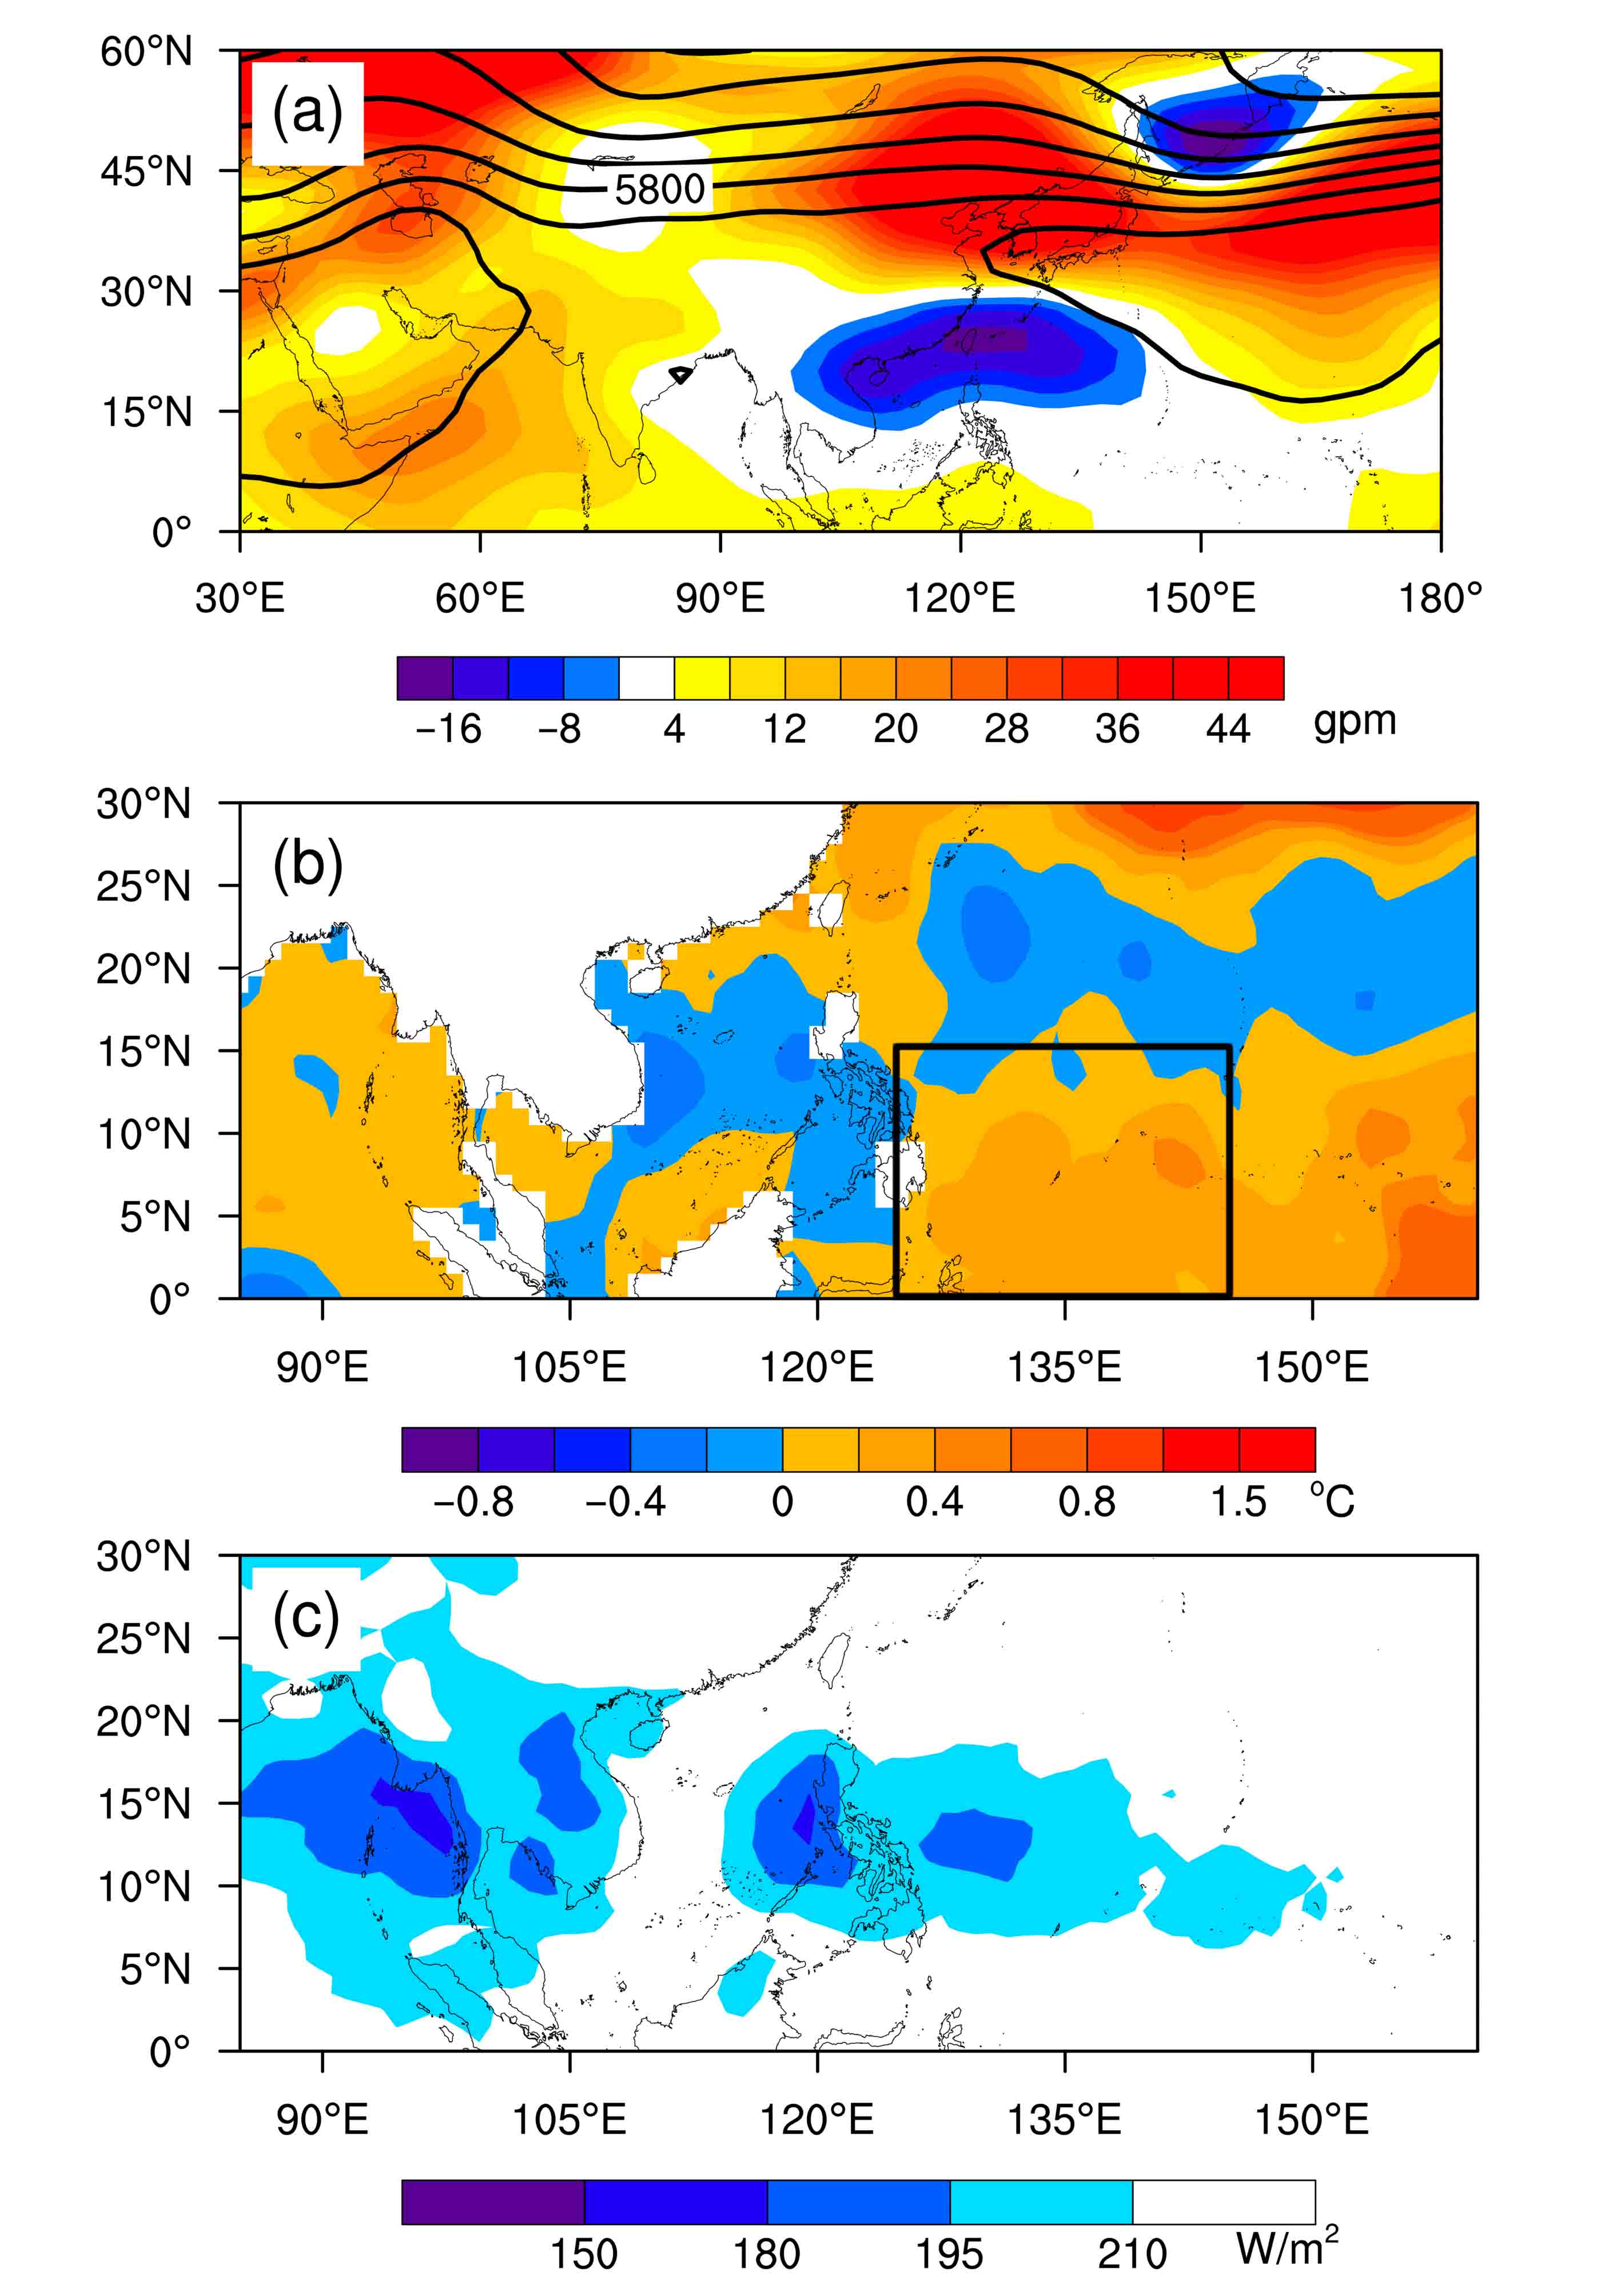
图 11 2018年7~8月平均的(a)500 hPa位势高度(等值线,单位:gpm)和位势高度异常场(填色,单位:gpm)、(b)海表温度异常(单位:℃)、(c)对外长波辐射场(OLR,单位:W/m2)。图(b)中黑色矩形框内为西太平洋暖池(0°~15°N,125°E~145°E)
Figure 11 (a) 500-hPa geopotential height (contour, units: gpm) and geopotential height anomalies (shaded, units: gpm), (b) sea surface temperature anomalies (units: ℃), and (c) outgoing longwave radiation (W/m2) from 1 July to 31 August 2018. The black rectangular frame in (b) represents the western Pacific warm pool (0°–15°N, 125°E–145°E)
Ambrizzi T, Hoskins B J, Hsu H H. 1995. Rossby wave propagation and teleconnection patterns in the austral winter[J]. J. Atmos. Sci., 52(21): 3661-3672. DOI:10.1175/1520-0469(1995)052<3661:RWPATP>2.0.CO;2
Black E, Blackburn M, Harrison G, et al. 2004. Factors contributing to the summer 2003 European heatwave[J]. Weather, 59(8): 217-223. DOI:10.1256/wea.74.04
Branstator G, Teng H Y. 2017. Tropospheric waveguide teleconnections and their seasonality[J]. J. Atmos. Sci., 74(5): 1513-1532. DOI:10.1175/JAS-D-16-0305.1
Chen H S, Teng F D, Zhang W X, et al. 2017. Impacts of anomalous midlatitude cyclone activity over East Asia during summer on the decadal mode of East Asian summer monsoon and its possible mechanism[J]. J. Climate, 30(2): 739-753. DOI:10.1175/JCLI-D-16-0155.1
Chen W, Lu R Y. 2014. A decadal shift of summer surface air temperature over Northeast Asia around the mid-1990s[J]. Adv. Atmos. Sci., 31(4): 735-742. DOI:10.1007/s00376-013-3154-4
Cruz R V, Harasawa H, Lal M, et al. 2007. Asia Climate Change, 2007: Impacts, Adaptation and Vulnerability. Contribution of Working Group II to the Fourth Assessment Report of the Intergovernmental Panel on Climate. Cambridge: Cambridge University Press, 469–506
Ding T, Qian W H. 2011. Geographical patterns and temporal variations of regional dry and wet heatwave events in China during 1960−2008[J]. Adv. Atmos. Sci., 28(2): 322-337. DOI:10.1007/s00376-010-9236-7
Dong B W, Sutton R T, Chen W, et al. 2016. Abrupt summer warming and changes in temperature extremes over Northeast Asia since the mid-1990s: Drivers and physical processes[J]. Adv. Atmos. Sci., 33(9): 1005-1023. DOI:10.1007/s00376-016-5247-3
Dong B W, Sutton R T, Shaffrey L. 2017. Understanding the rapid summer warming and changes in temperature extremes since the mid-1990s over western Europe[J]. Climate Dyn., 48(5-6): 1537-1554. DOI:10.1007/s00382-016-3158-8
Enomoto T. 2004. Interannual variability of the Bonin high associated with the propagation of Rossby waves along the Asian jet[J]. J. Meteor. Soc. Japan, 82(4): 1019-1034. DOI:10.2151/jmsj.2004.1019
Enomoto T, Hoskins B J, Matsuda Y. 2003. The formation mechanism of the Bonin high in August[J]. Quart. J. Roy. Meteor. Soc., 129(587): 157-178. DOI:10.1256/qj.01.211
Freychet N, Tett S, Wang J, et al. 2017. Summer heat waves over eastern china: Dynamical processes and trend attribution[J]. Environmental Research Letters, 12(2): 024015. DOI:10.1088/1748-9326/aa5ba3
Hong X W, Lu R Y, Li S L. 2017. Amplified summer warming in Europe-West Asia and Northeast Asia after the mid-1990s[J]. Environmental Research Letters, 12(9): 094007. DOI:10.1088/1748-9326/aa7909
黄荣辉, 孙凤英. 1994. 热带西太平洋暖池的热状态及其上空的对流活动对东亚夏季气候异常的影响[J]. 大气科学, 18(2): 141-151. Huang Ronghui, Sun Fengying. 1994. Impacts of the thermal state and the convective activities in the tropical Western Warm pool on the summer climate anomalies in East Asia[J]. Chinese Journal of Atmospheric Sciences (in Chinese), 18(2): 141-151. DOI:10.3878/j.issn.1006-9895.1994.02.02
Kunkel K E, Changnon S A, Reinke B C, et al. 1996. The July 1995 heat wave in the Midwest: A climatic perspective and critical weather factors[J]. Bull. Amer. Meteor. Soc., 77(7): 1507-1518. DOI:10.1175/1520-0477(1996)077<1507:TJHWIT>2.0.CO;2
Liang X Z, Wang W C. 1998. Associations between China monsoon rainfall and tropospheric jets[J]. Quart. J. Roy. Meteor. Soc., 124(552): 2597-2623. DOI:10.1002/qj.49712455204
Lin Z D, Lu R Y, Zhou W. 2010. Change in early-summer meridional teleconnection over the western North Pacific and East Asia around the late 1970s[J]. Int. J. Climatol., 30(14): 2195-2204. DOI:10.1002/joc.2038
Liu B Q, Wu G X, Mao J Y, et al. 2013. Genesis of the South Asian high and its impact on the Asian summer monsoon onset[J]. J. Climate, 26(9): 2976-2991. DOI:10.1175/JCLI-D-12-00286.1
Lu R Y, Oh J H, Kim B J. 2002. A teleconnection pattern in upper-level meridional wind over the North African and Eurasian continent in summer[J]. Tellus A: Dynamic Meteorology and Oceanography, 54(1): 44-55. DOI:10.3402/tellusa.v54i1.12122
Meehl G A, Tebaldi C. 2004. More intense, more frequent, and longer lasting heat waves in the 21st century[J]. Science, 305(5686): 994-997. DOI:10.1126/science.1098704
Palecki M A, Changnon S A, Kunkel K E. 2001. The nature and impacts of the July 1999 heat wave in the midwestern United States: Learning from the lessons of 1995[J]. Bull. Amer. Meteor. Soc., 82(7): 1353-1368. DOI:10.1175/1520-0477(2001)082<1353:TNAIOT>2.3.CO;2
Park J Y, Jhun J G, Yim S Y, et al. 2010. Decadal changes in two types of the western North Pacific subtropical high in boreal summer associated with Asian summer monsoon/El Niño-Southern Oscillation connections[J]. J. Geophys. Res., 115(D21): D21129. DOI:10.1029/2009JD013642
Perkins S E, Alexander L V, Nairn J R. 2012. Increasing frequency, intensity and duration of observed global heatwaves and warm spells[J]. Geophys. Res. Lett., 39(20): L20714. DOI:10.1029/2012GL053361
任芝花, 余予, 邹凤玲, 等. 2012. 部分地面要素历史基础气象资料质量检测[J]. 应用气象学报, 23(6): 739-747. Ren Zhihua, Yu Yu, Zou Fengling, et al. 2012. Quality detection of surface historical basic meteorological data[J]. Journal of Applied Meteorological Science (in Chinese), 23(6): 739-747. DOI:10.3969/j.issn.1001-7313.2012.06.011
Stainforth D A, Chapman S C, Watkins N W. 2013. Mapping climate change in European temperature distributions[J]. Environmental Research Letters, 8(3): 034031. DOI:10.1088/1748-9326/8/3/034031
Sutton R T, Dong B W. 2012. Atlantic Ocean influence on a shift in European climate in the 1990s[J]. Nature Geoscience, 5(11): 788-792. DOI:10.1038/ngeo1595
Wang W W, Zhou W, Li X Z, et al. 2016. Synoptic-scale characteristics and atmospheric controls of summer heat waves in China[J]. Climate Dyn., 46(9-10): 2923-2941. DOI:10.1007/s00382-015-2741-8
肖安, 周长艳. 2017. 基于超热因子的中国热浪事件气候特征分析[J]. 气象, 43(8): 943-952. Xiao An, Zhou Changyan. 2017. Characteristic analysis of the heat Wave Events over China based on excess heat factor[J]. Meteorological Monthly (in Chinese), 43(8): 943-952. DOI:10.7519/j.issn.1000-0526.2017.08.005
Xoplaki E, González-Rouco J F, Luterbacher J, et al. 2003. Mediterranean summer air temperature variability and its connection to the large-scale atmospheric circulation and SSTs[J]. Climate Dyn., 20(7-8): 723-739. DOI:10.1007/s00382-003-0304-x
Yan Z W, Xia J J, Qian C, et al. 2011. Changes in seasonal cycle and extremes in China during the period 1960-2008[J]. Adv. Atmos. Sci., 28(2): 269-283. DOI:10.1007/s00376-010-0006-3
Zhang P Q, Song Y, Kousky V E. 2005. South Asian high and Asian–Pacific–American climate teleconnection[J]. Adv. Atmos. Sci., 22(6): 915-923. DOI:10.1007/BF02918690
Zhao P, Zhang X D, Li Y F, et al. 2009. Remotely modulated tropical-North Pacific ocean−atmosphere interactions by the South Asian high[J]. Atmospheric Research, 94(1): 45-60. DOI:10.1016/j.atmosres.2009.01.018
Zhou C L, Wang K C. 2016. Coldest temperature extreme monotonically increased and hottest extreme oscillated over Northern Hemisphere land during last 114 years[J]. Scientific Reports, 6(1): 25721. DOI:10.1038/srep25721
Zhu Q G, He J H, Wang P X. 1986. A study of circulation differences between East-Asian and Indian summer monsoons with their interaction[J]. Adv. Atmos. Sci., 3(4): 466-477. DOI:10.1007/BF02657936
Figure 1 Geographical map of Northeast China including the Liaoning Province, Jilin Province, Heilongjiang Province, eastern part of Inner Mongolia Autonomous region, and northeastern part of Hebei Province. We selected 108 qualified stations without missing measement
Figure 2 Daily maximum temperature time series (red line) in Northeast China from May to August 2018. The blue line indicates the climatic state time series between May and August from 1971 to 2017 in Northeast China; black line represents the 30℃ line, which is defined as the extreme high temperature threshold in Northeast China
Figure 3 (a) High temperature days and (b) high temperature processes occurring at each station in Northeast China from May to August 2018. There are more than three continuous high temperature days during each high temperature process
Figure 4 Excess heat factor (℃2) index time series in Northeast China (solid black line), northern part of Northeast China (solid blue line), and southern part of Northeast China (solid red line) from May to August 2018
Figure 5 Boundary lines of the South Asia high (SAH) (solid blue lines), geopotential height anomalies (shaded, units: gpm) from 8 July to 31 August 2018, and climatological (1971–2017) boundary lines of the SAH from 8 July to 31 August (blue dotted lines): (a) 100 hPa; (b) 150 hPa; (c) 200 hPa; (d) 250 hPa, (e) 300 hPa; (f) 400 hPa. The solid red lines represent the western Pacific subtropical high (WPSH) boundary lines at 500 hPa, and red dotted lines represent the climatological (1971–2017) boundary lines of the WPSH at 500 hPa from 8 July to 31 August
Figure 6 Longitudinal–vertical sections of vorticity anomalies (
${10^{{\rm{ - }}5}}{{\rm{s}}^{ - 1}}$
) along (a) 35°N, (b) 37.5°N, (c) 40°N, (d) 42.5°N, (e) 45°N, and (f) 47.5°N from 8 July to 31 August 2018. The area of the red rectangular frame represents the geopotential height of 300–500 hPa over the southern region of Northeast China
图 7 2018年4月30日至9月30日东北南部(37.5°N~47.5°N,120°E~130°E)(a)涡度异常(阴影区,单位:10−5 s−1)和(b)垂直风场异常(阴影区,单位:10−2 Pa s−1)时间序列
Figure 7 Time series of (a) vorticity anomalies (10−5 s−1) and (b) vertical wind field anomalies (10−2 Pa s−1) in the southern part of Northeast China (37.5°N–47.5°N, 120°E–130°E) from 30 April to 30 September 2018
图 8 (a)2018年7~8月东北南部区域平均温度异常(红线)、西太平洋副热带高压脊线(黑线)和南亚高压指数(蓝线)标准化后的时间序列;2018年7~8月东北南部区域平均(b)涡度异常(单位:10−5 s−1)和(c)垂直风场异常(单位:10−2 Pa s−1)高度—时间序列
Figure 8 (a) Time series of standardized temperature anomalies (STA) in the southern part of Northeast China (red line), standardized WPSH ridge line (black line), and standardized SAH index (blue line) from July to August 2018; time–height series of (b) vorticity anomalies (10−5 s−1) and (c) vertical wind field anomalies (10−2 Pa s−1) in the southern region of Northeast China from July to August 2018
Figure 9 Positions of equal wind lines for zonal winds of 20 m/s and 25 m/s at a geopotential height at 200 hPa during the summer of 2018. The red line represents June, green line represents July, and blue line represents August
Figure 10 200-hPa horizontal wave activity fluxes (black vector arrow, units: m2/s2, and the horizontal wave activity fluxes less than 20 m2/s2 are not drawn) and horizontal wave active flux divergence fields (shaded, units: m
${{\rm{s}}^{ - 2}}$
) averaged for the six periods from July to August 2018: (a) From 1 to 8 July; (b) from 09 to 15 July; (c) from 16 July to 09 August; (d) from 10 to 13 August; (e) from 14 to 26 August; (f) from 27 to 31 August 2018
Figure 11 (a) 500-hPa geopotential height (contour, units: gpm) and geopotential height anomalies (shaded, units: gpm), (b) sea surface temperature anomalies (units: ℃), and (c) outgoing longwave radiation (W/m2) from 1 July to 31 August 2018. The black rectangular frame in (b) represents the western Pacific warm pool (0°–15°N, 125°E–145°E)


 下载:
下载:


 下载:
下载: