2 中国科学院大气物理研究所公共技术服务中心, 北京 100029;
3 南京信息工程大学气象灾害预报预警与评估协同创新中心, 南京 210044
2 Center of Technical Support and Service, Institute of Atmospheric Physics, Chinese Academy of Sciences, Beijing 100029;
3 Collaborative Innovation Center on Forecast and Evaluation of Meteorological Disasters, Nanjing University of Information Science and Technology, Nanjing 210044
大气臭氧变化在全球气候和环境中具有重要作用,是当今大气科学领域的重要研究对象之一(周秀骥等,1995;Von Der Gathen et al., 1995)。要认知臭氧总量变化的物理化学过程和对流层臭氧变化的原因,需要多种观测手段获取高质量探测数据作为基础来准确掌握大气臭氧的长期变化趋势和短期变化特征 (Kley et al., 1996)。通过分析观测数据,科研人员于20世纪80年代中期发现春季南极上空存在臭氧洞 (Chubachi, 1984;Farman et al., 1985;Stolarski et al., 1986),从此,对南极臭氧洞的监测及形成机理的研究引起人们广泛关注(陆龙骅等,1997)。
目前,全球大气臭氧总量的观测手段主要有地基(卞建春等,2005)、卫星(郑向东和韦小丽,2010)和探空观测(孔琴心等,1996;Zhang et al., 2014a)等。其中,地基观测常用仪器包括WOUDC观测网络的陶普生分光光度计 (Dobson ozone spectrophotometer)、布瑞沃尔分光光度计 (Brewer ozone spectrophotometer) 和滤光片型臭氧测量仪 (Filter ozonemeter)。我国有香河(Dobson)、昆明(Dobson)和瓦里关(Brewer)等观测站点(卞建春等,2005;郑向东和韦小丽,2010)。此外,NDACC (Network for the Detection of Atmospheric Composition Change)观测网络的地基SAOZ仪器也在全球多个站点进行大气臭氧总量探测 (Pommereau and Goutail, 1988)。卫星观测数据常由TOMS、GOME、OMI和SCIAMACHY等仪器提供 (Burrows et al., 1999;http://www.atmosp.physics.utoronto.ca/SPARC/News22/22_Wellemeyer.html [2016-02-04])。通过分析卫星资料,Zhou and Luo (1994)在20世纪90年代发现青藏高原存在臭氧低值中心,成为臭氧研究史上的重大发现之一。对于探空观测,国内科研人员先后研制出了具有自主知识产权的基于电化学原理的单池和双池臭氧探空系统,并已成功开展科学观测(孔琴心等,1996;王庚辰等,2003;Zhang et al., 2014b)。
地基仪器易于维护和标定,其臭氧总量观测资料具有较高的稳定性和延续性,作为检验卫星产品精度的手段之一,推动了卫星反演技术的发展。但是,由于观测仪器类型、定标系统和数据处理方法等存在差异,地基仪器实际观测资料会存在一定不确定性 (Vanicek, 2006)。因此,卫星数据可以作为一个相对参考标准来评估地基观测的稳定性和精准度 (Fioletov et al., 1999)。鉴于各种观测数据均存在测量误差,需要对不同臭氧探测资料进行对比研究,以定量获取它们之间的差异(Bojkov et al., 1988;郑向东,2008)。国内外科研人员陆续开展了相关工作,郑向东和韦小丽 (2010)指出卫星和地基观测资料存在不同,张中波等 (2006)指出两种资料之间具有相关相,Fioletov et al. (1999)和Labow et al. (2003)给出了卫星观测资料相对于地基观测资料所具有的标准差。
本文采用“三重制约法”(戴铁丕等,1989;潘闻天等,1997;河惠卿等,2009),分别对下列3组仪器提供的配对臭氧总量数据进行统计分析,提取出不同观测资料的误差标准差,进而对比分析了各种仪器的精度特征:1)1996~2003年期间地基WOUDC与星载TOMS和GOME仪器;2)2004~2013年期间地基WOUDC与星载OMI和SCIAMACHY仪器;3)2004~2013年期间地基SAOZ与星载OMI和SCIAMACHY仪器。此外,单独选取中国境内的3个站点分析了不同仪器观测臭氧总量结果的差异。希望本工作能为全球大气臭氧总量的变化趋势和平流层损耗等相关研究提供一定参考。
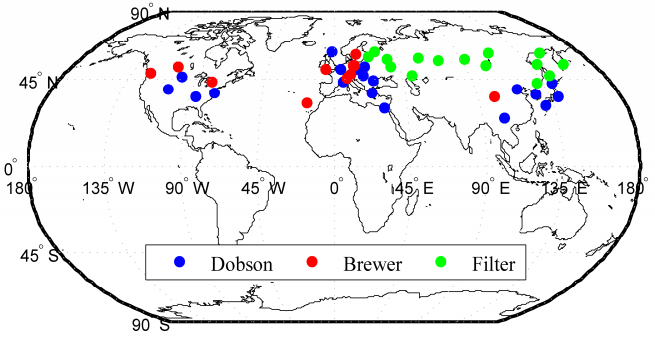
2 数据资料1996~2003年期间地基WOUDC与星载TOMS和GOME仪器配对臭氧总量数据取自北半球中纬度地区46个地面站点,这些站点的地理位置和地面观测仪器等信息如表 1所示,其中使用Brewer、Dobson和Filter仪器的站点数量分别为12、19和15个(图 1)。3类地基仪器观测的臭氧总量数据由WOUDC网站(http://www.msc-smc.ec.gc.ca/woudc[2016-02-04])提供。地基观测的起始时间为1996年,部分站点在2002和2003年前后终止观测。由于观测时段存在差异,不同站点的观测样本数目不同。整体来说,本文选取站点的观测资料具有较好的持续性和可靠性,与TOMS和GOME卫星观测共同匹配的样本数目均大于500组。
|
|
表 1 WOUDC 46个地基观测站的站号、站名、地理位置、海拔高度和观测仪器 Table 1 The station number, name, geographical position, height above the sea level and the instrument type of the 46 WOUDC ground-based stations |
|
图 1 地基WOUDC观测网络的Brewer(红点)、Dobson(蓝点)和Filter(绿点)仪器的地面站点分布 Fig. 1 The geographical distributions of the Brewer (red dots), Dobson (blue dots), and Filter (green dots) instruments in the ground-based WOUDC network |
由于地基WOUDC的部分站点终止观测,本文共使用2004~2013年期间21个地基WOUDC站点(如表 1所示)分析了地基与星载OMI和SCIAMACHY仪器的精度特征,3种资料在这些站点的配对样本数目均大于100组。此外,还分析了2004~2013年期间8个地基SAOZ仪器与星载OMI和SCIAMACHY配对观测数据,以提取SAOZ精度特征。这8个SAOZ站点分别为Haute_Provence(43.9°N,5.7°E),Kerguelen岛(49.4°S,70.3°E),Sodankyla(67.4°N,26.6°E),Scoresbysund(70.5°N,22.0°W),Reunion岛(20.9°S,55.5°E),Bauru(22.3°S,49.0°W),Dome C(75.1°S,123.4°E)和Rio Gallegos(51.6°S,69.3°W),3类仪器在这些站点的配对样本数目均大于500组。
TOMS为美国Earth Probe星载仪器,是用来测量地球整层大气总量的分光辐射探测器,过境时间为10:30(地方时,下同)。TOMS通过测量太阳后向散射紫外辐射来获得大气臭氧含量,是一种跨轨道扫描的Ebert-Fastie单色仪,每天可以提供一张经演算得出的全球臭氧分布图。因处理方法不同,TOMS数据有两个版本,即TOMS V7和V8,时间跨度分别为1996年8月至2004年6月和1996年8月至2003年8月。TOMS V8是V7的升级产品,除了在云的处理上有所提高 (McPeters and Labow, 1996;http://toms.gsfc.nasa.gov [2016-02-04]),还消除了极端条件,比如对流层气溶胶、太阳耀斑和高太阳天顶角等引起的误差 (http://www.atmosp.physics.utoronto.ca/SPARC/News22/22_Wellemeyer.html [2016-02-04])。
GOME于1995年4月21日搭载欧洲遥感卫星ERS-2升空,其主要任务是测量全球大气臭氧和其它几种微量气体的含量和分布情况,过境时间为当地时间10:30。GOME为被动式卫星遥感传感器,测量紫外—可见光波段地球表面及大气层的散射和太阳直接辐射,采用DOAS(Differential Optical Absorption Spectroscopy)方法反演大气臭氧斜柱总量,而后除以大气质量因子可得到(垂直)臭氧总量 (Burrows et al., 1999)。本文所用GOME观测资料时间范围为1996~2003年。
SCIAMACHY搭载欧洲航天局2002年3月1日发射的ENVISAT-1太阳同步极轨卫星升空,主要用于监测全球痕量气体、气溶胶和云的分布情况 (Bovensmann et al., 1999),利用DOAS算法反演臭氧总量 (Eskes et al., 2005)。轨道平均高度799.8 km,倾角98.55°,轨道周期100.59 mm,过境时间为当地时间10:00。每天围绕地球约14圈,传感器波长范围为240~2380 nm,每6 d对全球扫描1次,轨道重复周期为35 d。该仪器于2012年4月失效。
OMI是搭载于2004年7月15日美国发射的EOS-Aura卫星上的臭氧监测仪 (Levelt et al., 2006)。Aura为太阳同步轨道的近极轨卫星,轨道高度约为705 km,约在当地时间13:45过境。OMI传感器通过观测地球大气和表面的后向散射辐射来获取信息。传感器波长范围为270~500 nm,平均波谱分辨率为0.5 nm。星下点空间分辨率为13 km×24 km,扫描宽度为2600 km,1 d可覆盖全球。利用臭氧在331.2 nm和317.5 nm波段的强吸收特性进行臭氧总量反演。本文所采用的OMI臭氧总量产品利用DOAS算法反演得到 (Veefkind et al., 2006)。
3 分析方法精度、准度和精准度是常用来评价测量结果优劣的3个指标 (http://www.iso.org/iso/iso_catalogue/catalogue_tc/catalogue_detail.htm?csnumber=11833 [2016-02-04];http://www.bipm.org/utils/common/documents/jcgm/JCGM_200_2008.pdf [2016-02-04]),三者示意如图 2所示,其中原点表征待测量的真值。精度为多次重复测定同一量时各测定值之间彼此相符合的程度,表征测定过程中随机误差的大小。测量精度高(图 2a)是指偶然误差较小,即测量数据比较集中,但系统误差的大小,即准度,并不明确。准度是指在一定实验条件下,多次测定结果的平均值与真值相符合的程度,表征系统误差的大小。测量准度高(图 2b)是指系统误差较小,此时测量数据的平均值偏离真值较小,但数据分散的情况,即精度大小,并不确定。精准度为精度和准度两个指标的综合体。测量精准度高(图 2c)是指偶然误差(精度)和系统误差(准度)都比较小,这时测量数据集中分布在真值附近。

|
图 2 观测资料的(a)精度、(b)准度和(c)精准度示意图 Fig. 2 The diagrammatic sketch of the (a) precision, (b) accuracy, and (c) their combination of the observational data |
本文选取多个地基臭氧总量观测站点,以地基和星载仪器观测的配对臭氧总量数据作为研究对象,采用“三重制约法”提取各自资料的误差标准差,进而对比分析了不同仪器的精度特征。由于本研究所采用的“三重制约法”仅能解算出测量数据的误差标准差即精度特征,因此只对不同臭氧总量测量资料的精度进行对比分析,未对准度和精准度进行探讨。“三重制约法”介绍如下:
设臭氧总量实测数据为矩阵
| $ {a_{ij}} = {A_{ij}} - {t_j}, $ | (1) |
定义误差统计量:
| $ \overline {{a_i}} = \frac{1}{N}\sum\limits_{j = 1}^N {{a_{ij}}} ,{D_i} = \frac{1}{N}\sum\limits_{j = 1}^N {({a_{ij}} - \overline {{a_i}} } {)^2} $ | (2) |
分别是第i种观测数据的误差平均值和误差方差,各为表征观测数据准度和精度的定量指标。因为真值未知,故直接按照此定义不能计算得到误差方差。为此,按照“三重制约法”(戴铁丕等,1989;潘闻天等,1997;河惠卿等,2009),当Ai可由A按下列公式解算出Di。令
| $ \begin{array}{c} {X_{lk}}^{(j)} = {a_{lj}} - {a_{kj}} = {A_{lj}} - {A_{kj}},\\ \left( {l,\;k = 1,\;2,\;3;\;j = 1,\;2,\; \ldots ,\;N} \right) \end{array} $ | (3) |
记
| $ \overline {{X_{lk}}} = \frac{1}{N}\sum\limits_{j = 1}^N {\mathop {{X_{lk}}}\nolimits^{(j)} } = \frac{1}{N}\sum\limits_{j = 1}^N {({A_{lj}} - {A_{kj}}} ), $ | (4) |
则
| $ {S_{lk}} = \frac{1}{N}\sum\limits_{j = 1}^N {\mathop {({X_{lk}}}\nolimits^{(j)} - } \overline {{X_{lk}}} {)^2} $ | (5) |
表示两种资料之差的样本方差。因为3种资料均服从正态分布且两两相互独立,由统计学中两个相互独立的正态随机变量的和—差原理可得:
| $ {D_l} + {D_k} = {S_{lk}}\sqrt {{b^2} - 4ac} ,\;\left( {l,\;k = 1,\;2,\;3;\;l \ne k} \right) $ | (6) |
3个等式构成以D1、D2和D3为未知数的线性方程组:
| $ \left\{ \begin{array}{l} {D_{\rm{1}}} + {D_{\rm{2}}} = {S_{12}},\\ {D_{\rm{2}}} + {D_{\rm{3}}} = {S_{23}},\\ {D_{\rm{1}}} + {D_{\rm{3}}} = {S_{31}}, \end{array} \right. $ | (7) |
由此可以解得3个方差:
| $ \left\{ \begin{array}{l} {D_{\rm{1}}} = \frac{1}{2}({S_{12}} + {S_{{\rm{31}}}} - {S_{{\rm{23}}}}),\\ {D_{\rm{2}}} = \frac{1}{2}{S_{{\rm{23}}}} + {S_{{\rm{12}}}} - {S_{{\rm{31}}}}),\\ {D_{\rm{3}}} = \frac{1}{2}({S_{{\rm{31}}}} + {S_{{\rm{23}}}} - {S_{{\rm{12}}}}), \end{array} \right. $ | (8) |
进而可以求出3个误差标准差:
| $ \left\{ \begin{array}{l} {S_{\rm{1}}} = \sqrt {{D_{\rm{1}}}} = \sqrt {\frac{1}{2}\left( {{S_{{\rm{12}}}} + {S_{{\rm{31}}}} - {S_{{\rm{23}}}}} \right)} ,\\ {S_{\rm{2}}} = \sqrt {{D_{\rm{2}}}} = \sqrt {\frac{1}{2}\left( {{S_{{\rm{23}}}} + {S_{{\rm{12}}}} - {S_{{\rm{31}}}}} \right)} ,\\ {S_{\rm{3}}} = \sqrt {{D_{\rm{3}}}} = \sqrt {\frac{1}{2}\left( {{S_{{\rm{31}}}} + {S_{{\rm{23}}}} - {S_{{\rm{12}}}}} \right)} . \end{array} \right. $ | (9) |
根据统计学原理,误差标准差越小,数据的精度越高、越优。因此,通过对比分析计算得出的S1、S2、S3可以了解3组数据的精度分布特征,具体分析结果如第3节所示。
4 分析结果 4.1 WOUDC、TOMS和GOME精度1996~2003年期间,3类WOUDC地基与星载TOMS V8和GOME仪器在46个站点配对数据的样本组数如图 3a所示,其中,最大为1750组(#279站点),最小为560组(#143站点),大于1000组的站点共有22个(47.8%)。Brewer、Dobson和Filter测量臭氧总量精度分布如图 3b-3d所示。Brewer仪器精度主要分布在5~10 DU之间,共有7个站点(58.3%);最优和最差精度分别为4.1 DU和15.7 DU,各在瑞士Arosa(#35站点)和加拿大Toronto(#65站点)。整体来看,Dobson观测精度与Brewer相当,但分布更为集中,在5~10 DU之间的站点达到15个(79.0%);最优和最差精度分别为5.6 DU和14.5 DU,各在捷克Hradec Kralove(#96站点)和英国Lerwick(#43站点)。相比之下,Filter观测精度最差,除了Petropavlosk-Kamchatskii(#130站点)为9.7 DU外,其余站点均大于10 DU,最大值为23.6 DU(俄罗斯Nagaevo;#118站点)。Dobson、Brewer和Filter三类仪器的各自平均精度等信息如表 2总结。Brewer精度最优,平均值为7.9±3.3 DU/12;Dobson次之为8.7±2.3 DU/19,比Brewer略差;相比之下,Filter精度明显偏差,平均值为14.7±4.0 DU/15。本研究共涉及中国境内的3个地面站点,其中,瓦里关Brewer(#295站点)精度为7.8 DU,略优于所有该类仪器的平均值(7.9 DU);香河(#208站点)和昆明(#209站点)Dobson精度分别为6.7 DU和6.6 DU,明显优于所有该类仪器资料的平均精度(8.7 DU)。整体来说,国内3个地基站点观测资料均具有较优的精度。

|
图 3 (a)WOUDC、TOMS和GOME仪器在46个地面站点匹配数据的样本组数及地基(b)Brewer、(c)Dobson和(d)Filter观测资料的精度(单位:DU)分布 Fig. 3 (a) The sample number of the collocated total ozone column derived from the WOUDC instruments, TOMS, and GOME at 46 stations and the precisions (units: DU) of the data collected by the ground-based (b) Brewer, (c) Dobson, and (d) Filter |
|
|
表 2 3类WOUDC地基仪器的站点数目、仪器精度最优值、最差值和平均值及其标准差 Table 2 The number of the three kinds of ground-based WOUDC instruments and their best, worst, and average precisions with the standard deviations |
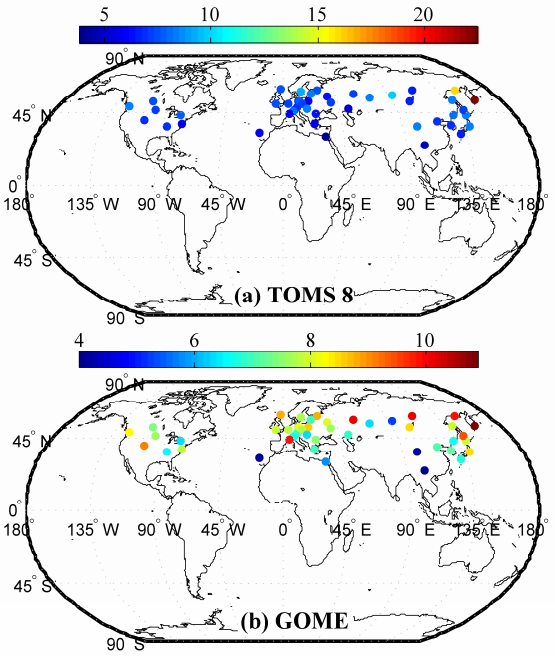
TOMS V8和GOME卫星观测数据精度如图 4所示。对于TOMS V8,位于俄罗斯Nagaevo(#118站点)和Petropavlosk-Kamchatsky(#130站点)两个Filter站点上空的卫星观测资料精度较差,分别为16.0 DU和22.5 DU。除此之外,其余站点上空的卫星数据精度均小于10 DU,其中最小值为3.8 DU,位于埃及Cairo(#152站点)。TOMS V8观测精度主要分布在5~10 DU之间,共有42个站点(91.3%)。相比于TOMS V8,不同站点上空的GOME观测数据精度变化更为稳定,最小值和最大值分别为4.1 DU和10.9 DU,各在昆明(#208站点)和Petropavlosk-Kamchatskii(#130站点)。GOME资料精度在5~10 DU之间的站点共有40个(87.0%)。所有地面站点及其对应的TOMS V8和GOME仪器的平均精度及其标准差等信息如表 3总结。整体来说,地面仪器精度较差(10.5±4.3 DU/46),这主要是由于Filter仪器精度较差引起。两种卫星仪器观测精度相当,分别为7.6±2.8 DU/ 46和7.6±1.5 DU/46;但是,不同站点上空GOME资料精度的标准差(1.5 DU)要小于TOMS V8(2.8 DU),表明前者精度在不同地区具有更高的稳定性。对于国内3个站点的地面仪器,瓦里关Brewer精度(7.8 DU)与两类卫星(7.6 DU)相当,香河(6.7 DU)和昆明(6.6 DU)两台Dobson仪器的精度要明显优于上述卫星结果。
|
图 4 (a)TOMS V8和(b)GOME观测资料的精度(单位:DU)分布 Fig. 4 The precisions (units: DU) of the measurements from (a) TOMS V8 and (b) GOME |
|
|
表 3 WOUDC、TOMS V8和GOME仪器精度最优值、最差值和平均值及其标准差 Table 3 The best, worst, and average precisions with the standard deviations of the WOUDC instruments, TOMS V8, and GOME |
本文进一步使用TOMS V7版本资料替换上述分析计算所用的TOMS V8版本资料,地基和GOME观测资料保持不变,用同样方法分析了3类数据的精度(结果如表 4所示)。对比表 3和表 4可知,尽管TOMS资料由V8替换为V7,但是由于地基和GOME资料不变,由“三重制约法”得到的地基和GOME两种仪器观测数据的精度基本保持不变,该结果的合理性表明“三重制约法”可以保持精度计算结果的稳定性。相比之下,TOMS V7资料的精度(8.5±3.0 DU/46)要明显差于TOMS V8(7.6±2.8 DU/46),验证后者算法比前者有所提高,这由于对云的处理改进等引起 (http://www.atmosp.physics.utoronto.ca/SPARC/News22/22_Wellemeyer.html [2016-02-04])。TOMS V7采用了ISCCP (International Satellite Cloud Climatology Project) 非实时遥感的月平均云量和云高数据资料 (McPeters and Labow, 1996),导致臭氧总量测值存在较大误差 (Newchurch et al., 2001;Liu et al., 2003),而TOMS V8臭氧总量产品对云的处理还参考了THIR (Temperature Humidity Infrared Radiometer) 云的产品资料 (http://toms.gsfc.nasa.gov [2016-02-04])。
|
|
表 4 WOUDC、TOMS V7和GOME仪器精度最优值、最差值和平均值及其标准差 Table 4 The best, worst, and average precisions with the standard deviations of the WOUDC instruments, TOMS V7, and GOME |
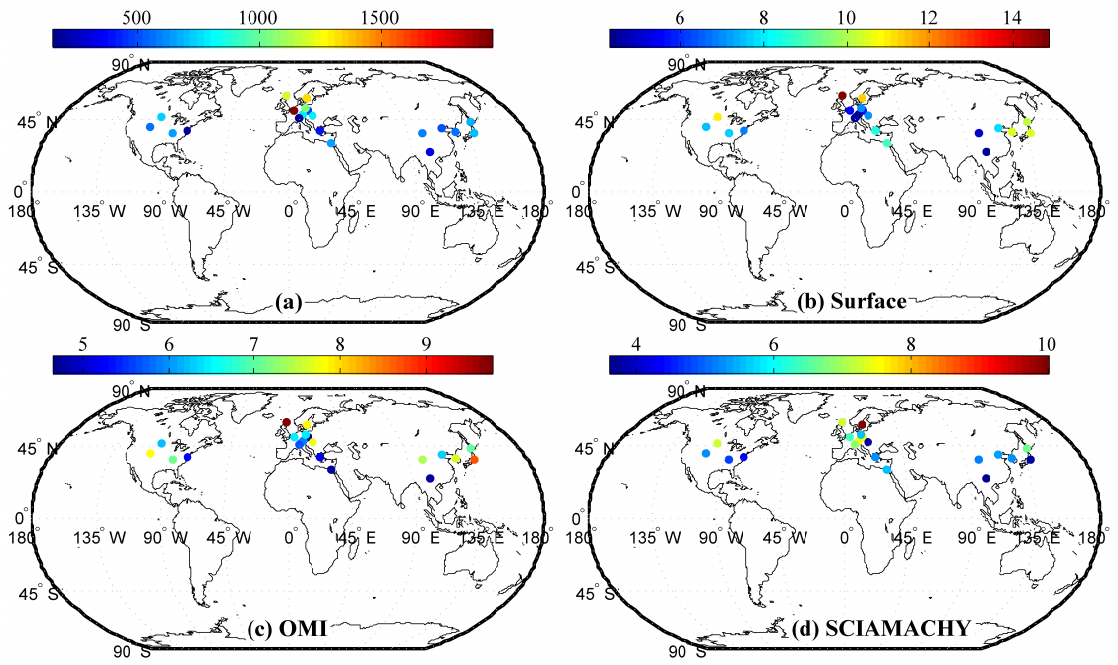
图 5a为2004~2013年期间21个地基WOUDC仪器(如表 1)与OMI和SCIAMACHY观测的配对数据样本组数,其中大于500组的站点共有16个(76.2%)。3种臭氧总量测量精度如图 5b-5d所示。WOUDC仪器精度分布在4~10 DU之间的站点共有15个(71.4%)。OMI和SCIAMACHY观测精度主要分布在5~8 DU之间,所占站点分别为16个(76.2%)和15个(71.4%)。3类仪器精度信息如表 5总结。整体来说,OIM和SCIAMACHY观测精度相当,分别为6.6±1.4 DU/21和6.0±1.6 DU/21。相比之下,地面仪器精度稍差(7.8±2.8 DU/21)。在计算2004~2013年期间21个WOUDC地基站点与OIM和SCIAMACHY探测精度基础上,本文进一步使用4.1节方法匹配1996~2003年期间这21个地基站点与TOMS V8和GOME观测资料,计算得到地基仪器精度为7.8±2.5 DU/21。可以看出,这21个WOUDC地基站点的精度在前后两个时间段内较为稳定(1996~2003年:7.8±2.5 DU/21;2004~2013年:7.8±2.8 DU/21),这也进一步表明“三重制约法”可以保持精度计算结果的稳定性。
|
图 5 (a)地基WOUDC、OMI和SCIAMACHY在21个站点匹配数据的样本组数;地基(b)WOUDC、(c)OMI和(d)SCIAMACHY的精度(单位:DU)分布 Fig. 5 (a) The sample number of the collocated total ozone column derived from the ground-based WOUDC, OMI, and SCIAMACHY at 21 stations and the precisions (units: DU) of the data collected by the ground-based (b) WOUDC, (c) OMI, and (d) SCIAMACHY |
|
|
表 5 WOUDC、OMI和SCIAMACHY仪器精度最优值、最差值和平均值及其标准差 Table 5 The best, worst, and average precisions with the standard deviations of the WOUDC instruments, OMI, and SCIAMACHY |
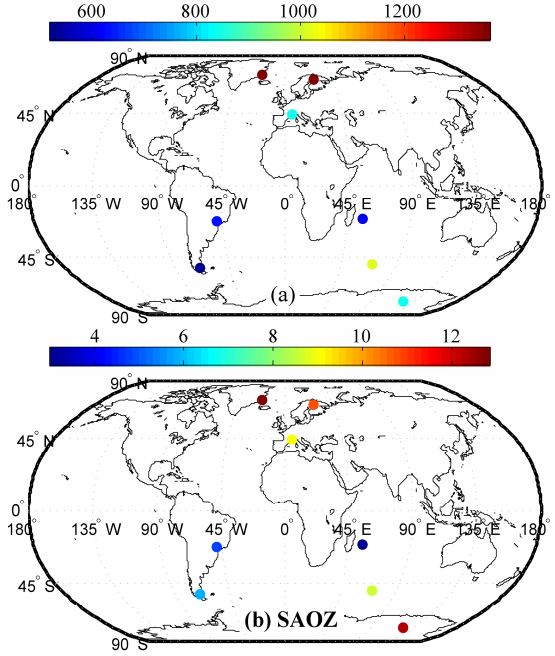
本文匹配分析了2004~2013年期间8个SAOZ地基站点与星载OMI和SCIAMACHY仪器观测数据,以提取SAOZ仪器精度信息(具体如图 6所示)。最小和最大匹配观测资料数目分别为517和1364。SAOZ仪器精度最优值和最差值分别为3.0和12.9 DU,各位于Reunion岛和Scoresbysund站点。SAOZ仪器平均精度为8.4±3.6 DU/8,与地基Dobson仪器接近(8.7±2.3 DU)。
|
图 6 (a)SAOZ站点观测资料匹配样本组数及其(b)精度(单位:DU)分布 Fig. 6 (a) The sample number of the collocated total ozone column at SAOZ sites and (b) the distribution of the SAOZ precisions (units: DU) |
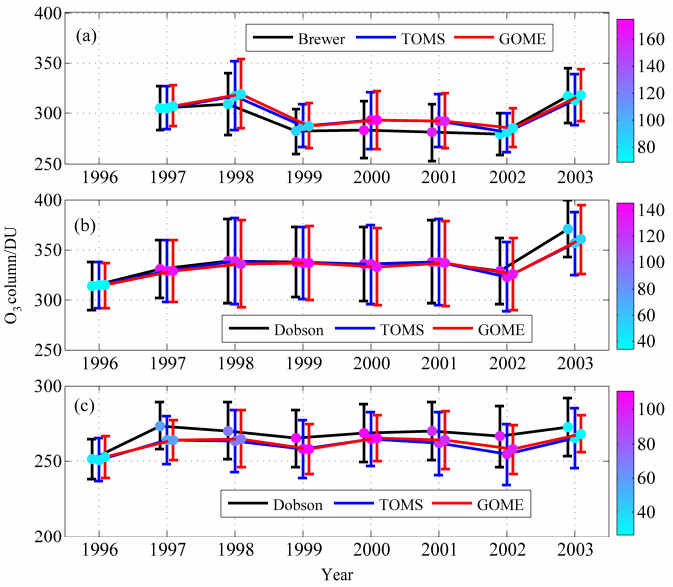
1996~2003年期间地基WOUDC与星载TOMS V8和GOME仪器在中国境内的瓦里关、香河和昆明3个站点多年臭氧总量观测结果的年际变化及其标准差如图 7所示,各个年份中圆点的色标代表 3种仪器在该年内匹配的观测样本组数。在瓦里关站点(图 7a),3类仪器观测臭氧总量基本分布在280~320 DU之间,且呈现出相似的变化趋势,其中在1998年和2003年观测到较大臭氧总量值,1999~2002年期间变化较为平稳。TOMS和GOME卫星观测结果较为接近,相比之下,地基Brewer在1998~2001年期间低于卫星观测,其中2001年的最大偏差为~11 DU。Brewer、TOMS和GOME年际臭氧总量平均值及其标准差分别为294.0±16.1 DU、298.6±13.8 DU和300.4±14.3 DU,地基仪器观测偏低~5 DU。香河站点臭氧总量(图 7d)在大多年份接近330 DU上下浮动。相比于瓦里关,3类仪器在香河站的观测结果更为吻合,偏差主要集中在3 DU之内;在2003年出现偏差较大应该是由于该年内观测样本相对较少(54组,如图中色标所示)、代表性较差引起。Dobson、TOMS和GOME观测臭氧总量年际平均值及其标准差分别为336.5±16.0 DU、333.8±12.4 DU和333.7±13.1 DU,整体较为接近。昆明站点臭氧总量分布在250~280 DU之间(图 7c),3种仪器观测也呈现出较为相似的变化趋势,整体来说,地基Dobson观测臭氧总量较大,平均值为267.1±7.0 DU,GOME次之为261.8±5.1 DU,TOMS最小为260.2±5.3 DU。
|
图 7 地基(黑线)与星载TOMS(蓝线)和GOME(红线)在中国境内的(a)瓦里关(Brewer)、(b)香河(Dobson)和(c)昆明(Dobson)站点观测臭氧总量的年际变化及其标准差。圆点的色标为各个年份内3种仪器匹配的观测样本组数 Fig. 7 Annual variations and their standard errors of the total ozone column derived from the ground-based instrument (black line), TOMS (blue line), and GOME (red line) at (a) Waliguan (Brewer), (b) Xianghe (Dobson), and (c) Kunming (Dobson) sites in China. The color of the dots denotes the sample number of the collocated total ozone column obtained from the three kinds of instruments in a certain year |
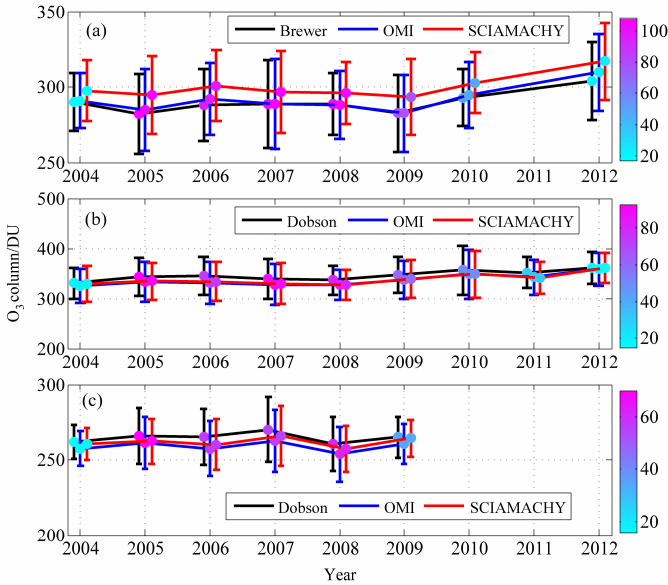
2004~2013年期间国内3个地基WOUDC仪器与星载OMI和SCIAMACHY观测臭氧总量结果如图 8所示。对于瓦里关站点,地基Brewer和OMI在各个年份臭氧总量观测值较为接近,SCIAMACHY结果明显偏高。3类仪器的年际臭氧总量平均值及其标准差分别为289.7±6.9 DU、291.4±8.3 DU和299.9±7.6 DU。尽管地基Dobson观测臭氧总量值比OMI和SCIAMACHY略大,但3种观测结果在香河整体吻合较好,其年际平均值分别为345.5±9.9 DU、336.7±10.9 DU和337.9±10.8 DU。昆明站点在2009年9月至2012年3月期间缺少地基观测数据,2010年之前地基Dobson仪器观测结果为264.8±3.3 DU,SCIAMACHY次之(261.7±3.2 DU),OMI最小(258.9±3.2 DU)。
|
图 8 同图 7,但为地基(黑线)与星载OMI(蓝线)和SCIAMACHY(红线)观测臭氧总量值 Fig. 8 Similar to Fig. 7, but for the total ozone column derived from the ground-based instrument (black line), OMI (blue line), and SCIAMACHY (red line) |
本文选取多个地基臭氧总量观测站点,运用“三重制约法”从观测资料的误差定义入手,在“真值”未知的情况下,匹配分析了不同地基(Brewer、Dobson、Filter和SAOZ)与星载仪器(TOMS、GOME、OMI和SCIAMACHY)观测臭氧总量资料,求算出了不同资料的误差标准差,进而对比分析了不同仪器的精度特征,并单独选取中国境内的3个站点分析了不同仪器观测臭氧总量结果的差异。结论如下:
(1)对于地基观测,Brewer仪器精度最优,平均值为7.9±3.3 DU/12;其次为SAOZ(8.4±3.6 DU/8)和Dobson(8.7±2.3 DU/19);Filter最差为14.7±4.0 DU/15。
(2)TOMS V8和GOME仪器观测精度相当,分别为7.6±2.8 DU/46和7.6±1.5 DU/46,后者在不同地区的稳定性更高。OMI和SCIAMACHYOIM在WOUDC地基站点的观测精度较为接近,分别为6.6±1.4 DU/21和6.0±1.6 DU/21。
(3)对于中国境内的3个地面站点,瓦里关Brewer精度为7.8 DU,略优于所有该类仪器的平均值(7.9 DU),与卫星结果接近(7.6 DU);香河和昆明两台Dobson仪器的精度分别为6.7 DU和6.6 DU,明显优于所有该类仪器的平均值(8.7 DU)及卫星结果。整体来说,国内地面仪器观测精度均较优,并且与卫星测量臭氧总量结果吻合较好。
致谢: 对本文所用资料提供方深表感谢,地基臭氧观测数据从WOUDC下载,TOMS臭氧总量数据从http://jwocky.gsfc.nasa.gov[2016-02-04]下载,GOME、OMI和SCIAMACHYOIM数据由TEMIS (Tropospheric Emission Monitoring Internet Service) 下载。| [] | 卞建春, 陈洪滨, 张中波, 等. 2005. 2002~2003年北半球中纬地区臭氧总量TOMS与地面观测的非常差异[J]. 科学通报, 50(6): 606–608. Bian Jianchun, Chen Hongbin, Zhang Zhongbo, et al. 2005. Unusual discrepancy between TOMS and ground-based measurements of the total ozone in 2002-2003[J]. Chinese Science Bulletin, 50(6): 606–608. DOI:10.1007/BF02897488 |
| [] | Bojkov R D, Mateer C L, Hansson A L. 1988. Comparison of ground-based and total ozone mapping spectrometer measurements used in assessing the performance of the global ozone observing system[J]. J. Geophys. Res., 93(D8): 9525–9533. DOI:10.1029/JD093iD08p09525 |
| [] | Bovensmann H, Burrows J P, Buchwitz M, et al. 1999. SCIAMACHY:Mission objectives and measurement modes[J]. J. Atmos. Sci., 56(2): 127–150. DOI:10.1175/1520-0469(1999)056<0127:SMOAMM>2.0.CO;2 |
| [] | Burrows J P, Weber M, Buchwitz M, et al. 1999. The global ozone monitoring experiment (GOME):Mission concept and first scientific results[J]. J. Atmos. Sci., 56(2): 151–175. DOI:10.1175/1520-0469(1999)056<0151:TGOMEG>2.0.CO;2 |
| [] | Chubachi S. 1984. Preliminary result of ozone observations at Syowa station from February 1982 to January 1983[J]. Memoirs of National Institute of Polar Research, 34: 13–19. |
| [] | 戴铁丕, 魏文遂, 王振会, 等. 1989. 用"三重制约法"研究三类测风仪的误差[J]. 气象, 15(4): 45–47. Dai Tiepi, Wei Wensui, Wang Zhenhui, et al. 1989. The errors of three kinds of anemoscopes derived from the triple control method[J]. Meteorology (in Chinese), 15(4): 45–47. DOI:10.7519/j.issn.1000-0526.1989.04.010 |
| [] | Eskes H J, van der A R J, Brinksma E J, et al. 2005. Retrieval and validation of ozone columns derived from measurements of SCIAMACHY on Envisat[J]. Atmos. Chem. Phys., 5(4): 4429–4475. DOI:10.5194/acpd-5-4429-2005 |
| [] | Farman J C, Gardiner B G, Shanklin J D. 1985. Large losses of total ozone in Antarctica reveal seasonal CIOx/NOx interaction[J]. Nature, 315(6016): 207–210. DOI:10.1038/315207a0 |
| [] | Fioletov V E, Kerr J B, Hare E W, et al. 1999. An assessment of the world ground-based total ozone network performance from the comparison with satellite data[J]. J. Geophys. Res., 104(D1): 1737–1747. DOI:10.1029/1998JD100046 |
| [] | 河惠卿, 王振会, 金正润, 等. 2009. 三种云导风资料及其对台风数值预报影响试验的比较分析[J]. 热带气象学报, 25(1): 82–88. Ha H K, Wang Zhenhui, Kim J Y, et al. 2009. Comparison of three cloud motion wind vectors and impact on typhoon track numerical forecast[J]. Journal of Tropical Meteorology (in Chinese), 25(1): 82–88. DOI:10.3969/j.issn.1004-4965.2009.01.010 |
| [] | Kley D, Crutzen P J, Smit H G J, et al. 1996. Observations of near-zero ozone concentrations over the convective Pacific:Effects on air chemistry[J]. Science, 274(5285): 230–233. DOI:10.1126/science.274.5285.230 |
| [] | 孔琴心, 刘广仁, 王庚辰. 1996. 1993年春季南极中山站上空大气臭氧的观测分析[J]. 大气科学, 20(4): 395–400. Kong Qinxin, Liu Guangren, Wang Gengchen. 1996. Observations and analyses of atmospheric ozone over Antarctic Zhongshan station in the spring of 1993[J]. Chinese Journal of Atmospheric Sciences (in Chinese), 20(4): 395–400. DOI:10.3878/j.issn.1006-9895.1996.04.02 |
| [] | Labow G J, McPeters R D, Bhartia P K. 2003. A comparison of TOMS Version 8 total column ozone data with data from groundstations[C]//American Geophysical Union, Fall Meeting 2003, abstract #A21D-0994. Washington, DC:AGU. |
| [] | Levelt P F, Hilsenrath E, Leppelmeier G W, et al. 2006. Science objectives of the ozone monitoring instrument[J]. IEEE Trans. Geosci. Remote Sens., 44(5): 1199–1208. DOI:10.1109/TGRS.2006.872336 |
| [] | Liu X, Newchurch M J, Kim J H. 2003. Occurrence of ozone anomalies over cloudy areas in TOMS version-7 level-2 data[J]. Atmospheric Chemistry and Physics, 3(4): 1113–1129. DOI:10.5194/acp-3-1113-2003 |
| [] | 陆龙骅, 卞林根, 贾朋群. 1997. 南极臭氧的短期气候变化特征[J]. 应用气象学报, 8(4): 402–412. Lu Longhua, Bian Lingen, Jia Pengqun. 1997. Short-term climatic change of Antarctic ozone[J]. Quarterly Journal of Applied Meteorology (in Chinese), 8(4): 402–412. |
| [] | McPeters R D, Labow G J. 1996. An assessment of the accuracy of 14[J]. 5 years of Nimbus 7 TOMS Version 7 ozone data by comparison with the Dobson network[J]. Geophys. Res. Lett., 23(25): 3695–3698. DOI:10.1029/96GL03539 |
| [] | Newchurch M J, Liu X, Kim J H, et al. 2001. On the accuracy of total ozone mapping spectrometer retrievals over tropical cloudy regions[J]. J. Geophys. Res., 106(D23): 32325–32326. DOI:10.1029/2000JD000151 |
| [] | 潘闻天, 朱玉华, 戴铁丕, 等. 1997. 气象仪器测量误差比较的n重制约法[J]. 南京气象学院学报, 20(2): 248–250. Pan Wentian, Zhu Yuhua, Dai Tiepi, et al. 1997. n fold restricting method for examining function and mesurement errors of meteorological instruments[J]. Journal of Nanjing Institute of Meteorology (in Chinese), 20(2): 248–250. |
| [] | Pommereau J P, Goutail F. 1988. O<sub>3</sub>and NO<sub>2</sub>ground-based measurements by visible spectrometry during arctic winter and spring 1988[J]. Geophys. Res. Lett., 15(8): 891–894. DOI:10.1029/GL015i008p00891 |
| [] | Stolarski R S, Krueger A J, Schoeberl M R, et al. 1986. Nimbus 7 satellite measurements of the springtime Antarctic ozone decrease[J]. Nature, 322(6082): 808–811. DOI:10.1038/322808a0 |
| [] | Vanicek K. 2006. Differences between ground Dobson, Brewer and satellite TOMS-8, GOME-WFDOAS total ozone observations at Hradec Kralove, Czech[J]. Atmospheric Chemistry and Physics, 6(12): 5163–5171. DOI:10.5194/acp-6-5163-2006 |
| [] | Veefkind J P, de Haan J F, Brinksma E J, et al. 2006. Total ozone from the Ozone Monitoring Instrument (OMI) using the DOAS technique[J]. IEEE Trans. Geosci. Remote Sens., 44(5): 1239–1244. DOI:10.1109/TGRS.2006.871204 |
| [] | Von Der Gathen P, Rex M, Harris N R P, et al. 1995. Observational evidence for chemical ozone depletion over the Arctic in winter 1991-92[J]. Nature, 375(6527): 131–134. DOI:10.1038/375131a0 |
| [] | 王庚辰, 孔琴心, 宣越健, 等. 2003. 中国大气臭氧探空仪的研制和应用[J]. 地球科学进展, 18(3): 471–475. Wang Gengchen, Kong Qinxin, Xuan Yuejian, et al. 2003. Development and application of ozonesonde system in China[J]. Advance in Earth Sciences (in Chinese), 18(3): 471–475. DOI:10.11867/j.issn.1001-8166.2003.03.0471 |
| [] | Zhang J Q, Xuan Y J, Yan X L, et al. 2014a. Development and preliminary evaluation of a double-cell ozonesonde[J]. Adv. Atmos. Sci., 31(4): 938–947. DOI:10.1007/s00376-013-3104-1 |
| [] | Zhang J Q, Xuan Y J, Xia X A, et al. 2014b. Performance evaluation of a self-developed ozonesonde and its application in an intensive observational campaign[J]. Atmospheric and Oceanic Science Letters, 7(3): 175–179. |
| [] | 张中波, 卞建春, 陈洪滨, 等. 2006. 根据Brewer和TOMS资料分析、验证瓦里关地区大气臭氧总量变化特征[J]. 气候与环境研究, 11(4): 451–456. Zhang Zhongbo, Bian Jianchun, Chen Hongbin, et al. 2006. Analyze and verify variation features of total atmospheric ozone in Mountain Waliguan based on comparison between Brewer and TOMS data[J]. Climatic and Environmental Research (in Chinese), 11(4): 451–456. DOI:10.3878/j.issn.1006-9585.2006.04.02 |
| [] | 郑向东. 2008. 云对中国区域卫星观测臭氧总量精度影响的检验分析[J]. 大气科学, 32(6): 1431–1444. Zheng Xaingdong. 2008. Investigation on effect of cloud on the precision of total ozone from satellite measurements over China regions[J]. Chinese Journal of Atmospheric Sciences (in Chinese), 32(6): 1431–1444. DOI:10.3878/j.issn.1006-9895.2008.06.17 |
| [] | 郑向东, 韦小丽. 2010. 中国4个地点地基与卫星臭氧总量长期观测比较[J]. 应用气象学报, 21(1): 1–10. Zheng Xiangdong, Wei Xiaoli. 2010. Long-term total ozone comparisons between space-based and ground-based observations at 4 sites in China[J]. Journal of Applied Meteorological Science (in Chinese), 21(1): 1–10. DOI:10.3969/j.issn.1001-7313.2010.01.001 |
| [] | Zhou X J, Luo C. 1994. Ozone valley over Tibetan Plateau[J]. Acta Meteorologica Sinica, 8(4): 505–506. |
| [] | 周秀骥, 罗超, 李维亮, 等. 1995. 中国地区臭氧总量变化与青藏高原低值中心[J]. 科学通报, 40(15): 1396–1398. Zhou Xiuji, Luo Chao, Li Weiliang, et al. 1995. The change of the total ozone in China and the ozone valley over Tibetan Plateau[J]. Chinese Science Bulletin (in Chinese), 40(15): 1396–1398. |
 2017, Vol. 22

