2 中国气象科学研究院灾害天气国家重点实验室, 北京 100081
2 State Key Laboratory of Severe Weather, Chinese Academy of Meteorological Sciences, Beijing 100081
冬季对流层高层急流的变化对我国冬季的温度和降水有重要的影响,因此研究高空急流的位置和强度变化特征及其异常活动机理,对提高东亚区域尤其是我国天气和气候变化的预测水平具有重要的科学意义(张耀存等,2008)。当冬季西风急流强度增强(减弱)时,西伯利亚高压增强(减弱)和阿留申低压加强(减弱),进一步使东亚大槽偏强(弱),导致冬季风强度偏强(弱),引起我国从北到南的陆面降温(增温),同时使得华北、华中和长江中下游地区降水偏少(多)(Yang et al., 2002;毛睿等,2007;况雪源等,2008;叶丹和张耀存,2014)。通过对极锋急流的结构和季节变化及其与东亚天气气候的关系的深入研究,张耀存等(2008)指出极锋急流的强度与副热带急流位置之间具有协同变化关系,与中国东部地区冬季和夏季的降水之间具有显著的相关关系,因而从气候平均的角度来看它对亚洲季风爆发和梅雨开始有预示作用。这种副热带急流与极锋急流的协同变化对2008年1月我国南方雨雪冰冻天气的冷暖空气异常活动有重要作用(Liao and Zhang, 2013;张春艳和张耀存,2013)。东亚寒潮爆发过程中,高空波动的动量和热通量输送,使高空急流迅速加速并同时导致急流人口区质量环流的加强,从而引起中高纬度对流层顶下沉并使高空锋区加强(高守亭等,1992)。另外,高层西风急流能够作为大气波动的波导,大气波动沿急流由西向东传播,从而引起东亚气候异常。比如,年际内正的北大西洋涛动(NAO)信号沿东亚急流向东传引起东亚地区地表变暖(Watanabe,2004),但是在过去半个世纪东传正NAO信号,在3月份到达东亚,引起东亚地区上对流层降温(Yu and Zhou, 2004,2007;Li et al., 2005;Xin et al., 2006)。
众所周知,大气中存在两种不同的急流类型:副热带急流和极锋急流。副热带急流是由平均经向环流(Hadley环流)引起的行星角动量平流驱动,并且急流位于Hadley环流的极地侧(Held and Hou, 1980;Hou,1998;Lee and Kim, 2003;Lachmy and Harnik, 2014)。Hadley环流是由热带地区的热对流和辐射加热驱动,因此副热带急流也称为热力驱动急流。相比于副热带急流,极锋急流是由涡动量通量散度驱动,因此极锋急流也称为涡驱动急流(Carillo et al., 2000;Lee and Kim, 2003;Orlanski,2005;Ren et al., 2008, 2010, 2011;Liao and Zhang, 2013)。
2008年1月10日至2月2日,我国南方遭遇了一次罕见、持续时间长、强度大的低温雨雪冰冻灾害(Wang et al., 2009;Sun and Zhao, 2010)。此次灾害天气过程可分为4次过程:1月11~17日、18~22日、25~30日和1月31日至2月2日(Wang et al., 2009;Sun and Zhao, 2010)。造成此次持续性低温雨雪冰冻极端灾害天气的因素有很多(顾雷等,2008;李崇银等,2008;王东海等,2008;赵思雄和孙建华,2008;Liao and Zhang, 2013;张春艳和张耀存,2013),其中东亚高空急流对其有重要的作用(Liao and Zhang, 2013;张春艳等,2013)。本文分析东亚急流对2008年初我国南方遭受的雨雪冰冻灾害的影响,并从能量的角度给出东亚急流变化的可能原因。
2 数据和方法本文采用欧洲中期天气预报中心(ERA-Interim)提供的一天4次的再分析数据[1°(纬度)×1°(经度)],空间层次为1000 hPa~1 hPa,共37层(Dee et al., 2011)。降水数据是由中国气象局提供的725站站点逐日降水观测数据。
为了研究与急流有关的扰动动能的特征,我们将计算扰动动能方程(Orlanski and Katzfey, 1991;Orlanski and Sheldon, 1993)中的各项。扰动动能(k')定义为k'=(u'2+v'2),u、v分别表示纬向风和经向风,上划线表示纬向平均,右上角撇表示叠加在纬向平均上的扰动。则扰动动能方程可写为:
| $\begin{array}{l} \frac{{\partial {k^\prime }}}{{\partial t}} = - \mathit{\boldsymbol{\bar V}} \cdot \nabla {k^\prime } - {\mathit{\boldsymbol{V}}^\prime } \cdot \nabla {k^\prime } - \mathit{\boldsymbol{\bar V}} \cdot \nabla {\phi ^\prime } - {\omega ^\prime }{\alpha ^\prime } - \\ \quad \quad \quad \mathit{\boldsymbol{V}}_2^\prime \cdot \left( {{\mathit{\boldsymbol{V}}^\prime } \cdot \nabla {{\mathit{\boldsymbol{\bar V}}}_2}} \right) + \mathit{\boldsymbol{V}}_2^\prime \cdot \left( {\overline {{\mathit{\boldsymbol{V}}^\prime } \cdot \nabla \mathit{\boldsymbol{V}}_2^\prime } } \right) + R, \end{array}$ | (1) |
其中,ω(ω=dp/dt)是垂直速度,V = [u, v, ω ]T(T表示转置),p表示气压(单位:hPa),▽是三维梯度算子,φ'表示位势扰动。方程(1)左边为扰动动能趋势项(
| $ - {\mathit{\boldsymbol{V}}^\prime } \cdot \nabla {\phi ^\prime } = - \nabla \left( {\mathit{\boldsymbol{V}}_{\rm{a}}^\prime {\phi ^\prime }} \right),$ | (2) |
其中,下标a表示非地转,Va= [ua, va, ω]T,方程(2)右边表示非地转风位势通量散度;方程(1)右边第四项(
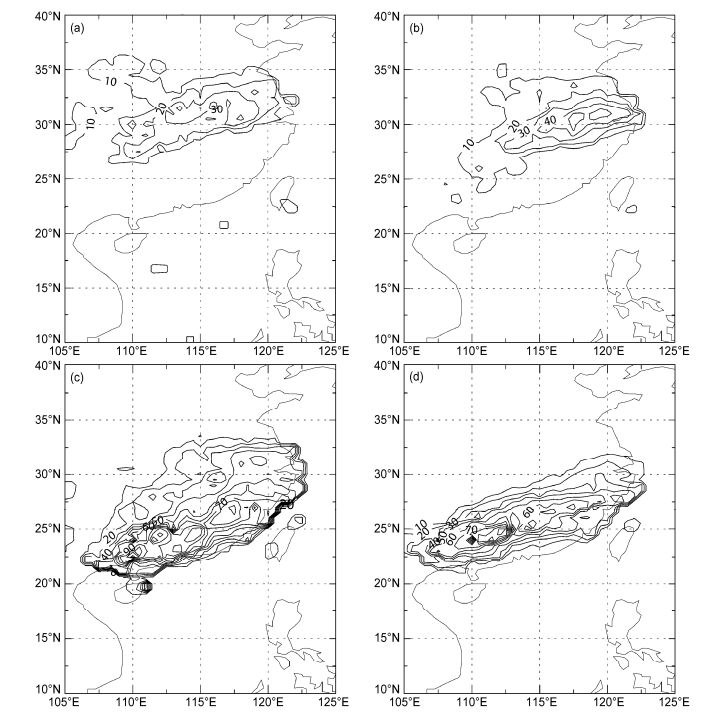
图 1是灾害天气发生期间4个阶段中降水量的分布。第一阶段(1月11~17日)中,明显的带状降水主要发生在长江流域下游地区(图 1a)。第二阶段(1月18~22日)中带状降水增强,从30 mm增长到50 mm,并向南蔓延(图 1b)。与前两阶段相比,第三阶段(1月25~30日)有了明显的增强,最大降水超过90 mm,整个降水带控制我国西南地区(图 1c)。第四阶段(1月31日至2月2日)与第三阶段相似,但是降水带范围要小并且稍微向北移动(图 1d)。
|
图 1 2008年1月11日至2月2日我国南方雨雪冰冻灾害期间降水量(单位:mm)分布:(a)第一阶段(1月11~17日);(b)第二阶段(1月18~22日);(c)第三阶段(1月25~30日);(d)第四阶段(1月31日至2月2日) Fig. 1 Distributions of the accumulative precipitation amount (mm) in (a) the first stage (11-17 January), (b) the second stage (18-22 January), (c) the third stage (25-30 January), and (d) the fourth stage (31 January to 2 February) of the snowstorm event in 2008 over southern China |
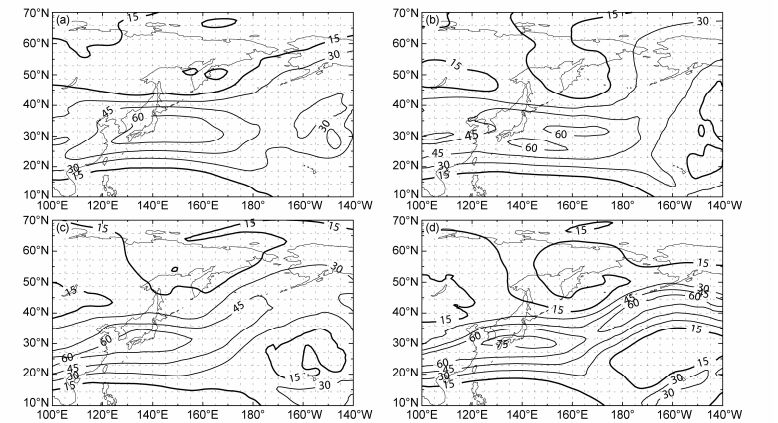
图 2是灾害天气过程中4个阶段300 hPa全风速(
|
图 2 2008年1月11日至2月2日我国南方雨雪冰冻灾害期间300 hPa风场(全风速 |
为了说明急流对灾害天气的影响,我们给出了105°E到120°E平均的垂直运动和风场纬度——高度剖面图,如图 3所示。这个区域位于我国上空,同时也是东亚急流的入口处。随着急流的增强,在20°N~30°N上升运动也明显的增强(图 3)。急流的南北范围也变窄,这使得垂直上升运动南北范围变小。这样的一系列的变化有利于降雨强度增强和南北范围缩小(图 3)。实际上,在一天4次的数据分析中,雨带的南北移动也与急流的南北移动有关,急流的南北移动使得急流入口处的次级环流的上升支南北移动,从而引起降雨的南北移动(图略)。第一阶段,急流较弱,上升运动较弱,最大上升运动发生在25°N~30°N(图 3a)。第二阶段,急流增强,上升运动增强,低层上升运动向南扩展(图 3b),这使得降雨向南移动(图 1a、1b)。第三阶段,急流中心强风范围扩大,上升运动明显增强,最大上升中心向南移动到了20°N~25°N(图 3c),降雨也随之增强并向南移动到我国西南地区(图 1c)。第四阶段,急流继续增强而南北范围缩小,上升运动继续增强但是南北范围减小(图 3d),这使得降雨继续增强,但是雨带变窄(图 1d)。从上面的分析中,我们得知急流的变化与降雨的强度和范围有非常重要的联系。另外,在低层700 hPa附近,存在明显的低空急流(全风速>12 m/s),有利于将南海西太平洋上空的水汽输送到降雨区域,使降雨得以持续(图 3)。从第一到第四阶段,低空急流增强,为雨区提供更丰富的水汽,有利于降雨的增强(图 3)。

|
图 3 2008年1月11日至2月2日我国南方雨雪冰冻灾害期间105°E~120°E平均垂直运动和风场的纬度—高度剖面(填色和细实线:风场,间隔:15 m/s;实线:下沉运动,虚线:上升运动,间隔:5×10-2 Pa/s):(a)第一阶段;(b)第二阶段;(c)第三阶段;(d)第四阶段 Fig. 3 Pressure-latitude cross sections of the vertical velocity and wind averaged between 105°E-120°E (wind: colored with thin solid lines, intervals: 15 m/s; thick solid lines: descending motion, thick dashed line: ascending motion, intervals: 5×10⁻² Pa/s) in (a) the first stage, (b) the second stage, (c) the third stage, and (d) the fourth stage of the snowstorm event in 2008 over southern China |
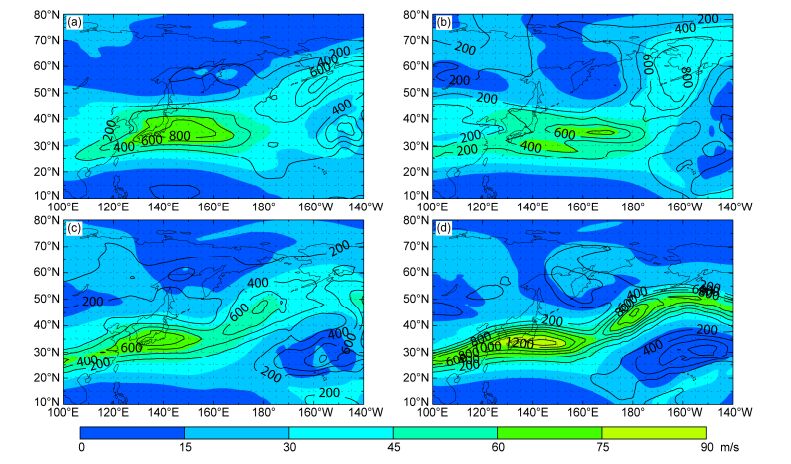
为了得到东亚急流变化的可能原因,我们计算了灾害天气过程中的扰动动能,如图 4所示。东亚急流中心与扰动动能中心很好的重合,扰动动能的发展能够很好的表示急流的变化(图 4)。在东亚急流出口的北部地区存在明显的弱风区(<30 m s-1)(图 2和图 4)。同时,我们注意到,在东亚急流北部的弱风区也同样存在较大的扰动动能(图 4)。
|
图 4 2008年1月11日至2月2日我国南方雨雪冰冻灾害期间300 hPa扰动动能(黑实线,间隔:200 m2/s2)和风场(填色,间隔:15 m/s)分布:(a)第一阶段;(b)第二阶段;(c)第三阶段;(d)第四阶段 Fig. 4 Distributions of eddy kinetic energy at 300 hPa (black solid lines, intervals: 200 m2/s2) and wind (colored, intervals: 15 m/s) in (a) the first stage, (b) the second stage, (c) the third stage, and (d) the fourth stage of the snowstorm event in 2008 over southern China. |
那么与东亚急流有关的扰动动能的变化是由什么引起的?弱风区中的扰动动能对东亚急流区的扰动动能有无影响?针对这两个问题,我们计算了公式(1)中的各项。方程(1)右边第一项和第二项是平均平流项和扰动平流项,这两项的主要作用是在急流内部搬运扰动动能,而不净产生扰动动能,因此本文没有给出这两项的分布图。方程右边最后一项是剩余项,包含了次网格尺度的运动、热力作用等,这些都是难以计算的,所以本文中也没有给出其分布图。
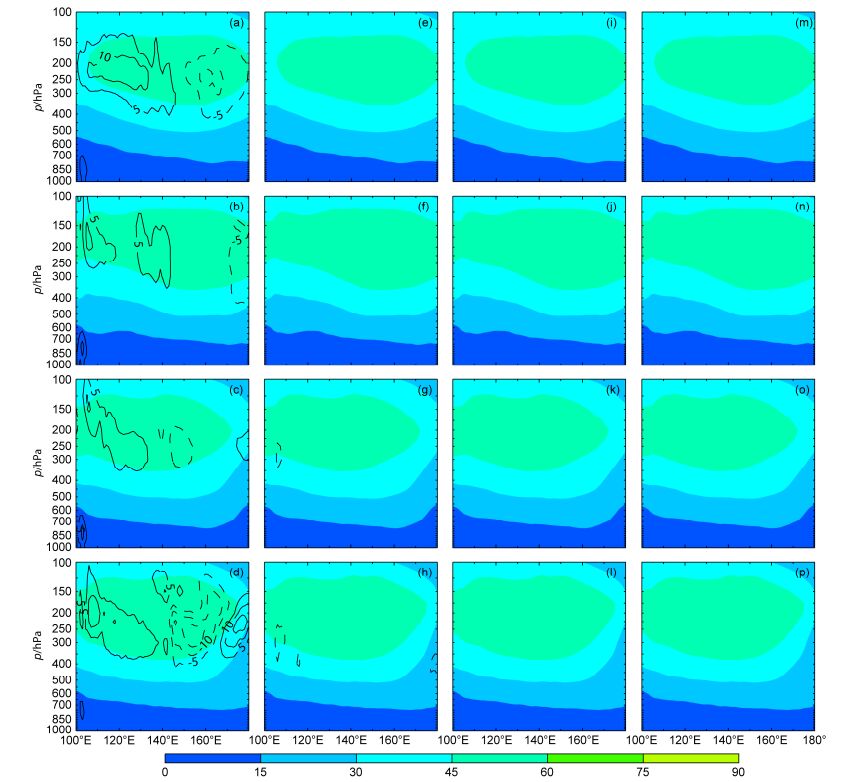
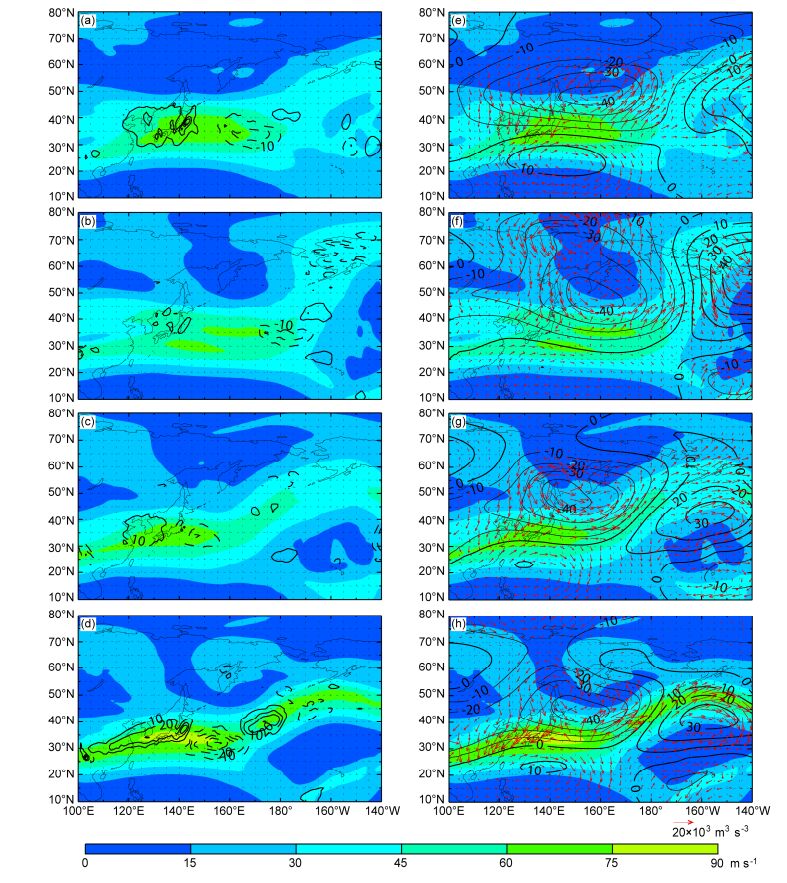
图 5给出了方程(1)中扰动动能的净产生项在急流区域(20°N~40°N)经度—高度的分布,分别是扰动位势平流项(GKe)、扰动有效位能转换项(CAeKe)、扰动动能与相互作用动能转换项(CKiKe)和雷诺效应项(RKe)。从图 5中可以看出,灾害天气的4个阶段扰动位势平流的变化是扰动动能变化的主要原因。这说明东亚急流变化主要是由急流附近位势的改变引起的。对流层中高层急流主要由地转风构成,位势梯度变化能表示地转风的变化,因此从长期(相对于一天4次的记录,每个阶段的时间范围时间较长)位势平流是动能净产生的主要原因。同样在扰动动能方程中,扰动位势平流的变化仍然决定了扰动动能的变化,该项并不表示扰动动能与其他能量之间的转化,它是与扰动位势的变化有关的项。在东亚急流的入口处扰动位势平流辐合使扰动动能增加,增加的扰动动能被平流项输送到东亚急流的出口处,在此处扰动位势平流辐散使东亚急流的扰动动能减弱(图 5a-5d)。
|
图 5 2008年1月11日至2月2日我国南方雨雪冰冻灾害期间扰动位势平流项(GKe,第一列)、扰动有效位能转换项(CAeKe,第二列)、雷诺效应项(RKe,第三列)、相互作用能量转换项(CKiKe,第四列)和风场20°N~40°N平均的经度—高度剖面(填色表示风场,间隔:15 m/s;黑实线表示正,黑虚线表示负,间隔:5 m2/s3):(a、e、i、m)第一阶段;(b、f、j、n)第二阶段;(c、g、k、o)第三阶段;(d、h、i、p)第四阶段 Fig. 5 Pressure−longitude cross sections of GKe (Generation of eddy Kinetic energy, the first column), CAeKe(Conversion rate from Available potential energy to eddy Kinetic energy, the second column), RKe (Reynolds stresses of eddy Kinetic energy, the third column), CKiKe (Conversion rate from Ineraction Kinetic energy to eddy Kinetic energy, the fourth column) and wind averaged between 20°N−40°N (colored indicates wind, intervals: 15 m/s; black solid lines indicate positive and black dashed line indicates negative, intervals: 5 m2/s3) in (a, e, i, m) the first stage, (b, f, j, n) the second stage, (c, g, k, o) the third stage, and (d, h, i, p) the fourth stage of the snowstorm event in 2008 over southern China |
那么东亚急流入口处增加的扰动动能来自什么区域?出口处减少的扰动动能被输送到了什么地方呢?我们将扰动位势平流项改写,如公式(2)所示。扰动位势平流可以改写为非地转风扰动位势通量散度。非地转风扰动位势通量矢量可以表示扰动动能的输送方向(Orlanski and Katzfey, 1991;Orlanski and Sheldon, 1993)。
图 6给出了4次灾害过程的扰动位势平流(图 6a-6d)和非地转风扰动位势通量矢量以及扰动位势(图 6e-6h)在300 hPa的分布。如图 6所示,在东亚急流的入口处扰动位势平流辐合,而在急流出口处扰动位势平流辐散,特别是第一阶段(图 6a)和第四阶段(图 6d)。那么这些辐合的能量来自什么地方呢?如图 6e-6h所示,东亚急流入口处的辐合扰动动能主要来自于东亚急流北部的弱风区扰动动能中心。非地转风位势通量将弱风区的扰动动能向西南输送到东亚急流的入口区并辐合,使东亚急流入口区扰动动能增强。东亚急流北部地区的弱风区扰动动能中心位于低压区,扰动动能的输送受到低压的控制(图 6e-6h)。
|
图 6 2008年1月11日至2月2日我国南方雨雪冰冻灾害期间300 hPa(a-d)扰动位势平流项(黑实线表示正平流,黑虚线表示负平流,间隔:5 m2/s3)和风场(填色,间隔:15 m/s)分布以及(e-h)非地转风扰动位势通量矢量(箭头,单位矢量:20×103 m3/s3)、扰动位势(粗、细实线表示正、负扰动位势,间隔:10×102 m2/s2)和风场(填色,间隔:15 m/s)分布:(a、e)第一阶段;(b、f)第二阶段;(c、g)第三阶段;(d、h)第四阶段 Fig. 6 Distributions of (a-d) eddy geopotential advection (black solid lines indicate positive and black dashed lines indicate negative, intervals: 10 m2/s3) and wind (colored, white thin solid lines, intervals: 15 m/s), and (e-h) ageostrophic geopotential flux (vectors, units: 20×103 m3/s3), eddy geopotential (thick and thin black solid lines indicate positive and negative seperately, intervals: 10×102 m2/s2) and wind (colored, white thin solid lines, intervals: 15 m/s) at 300 hPa in (a, e) the first stage, (b, f) the second stage, (c, g) the third stage, (d, h) the fourth stage of the snowstorm event in 2008 over southern China |
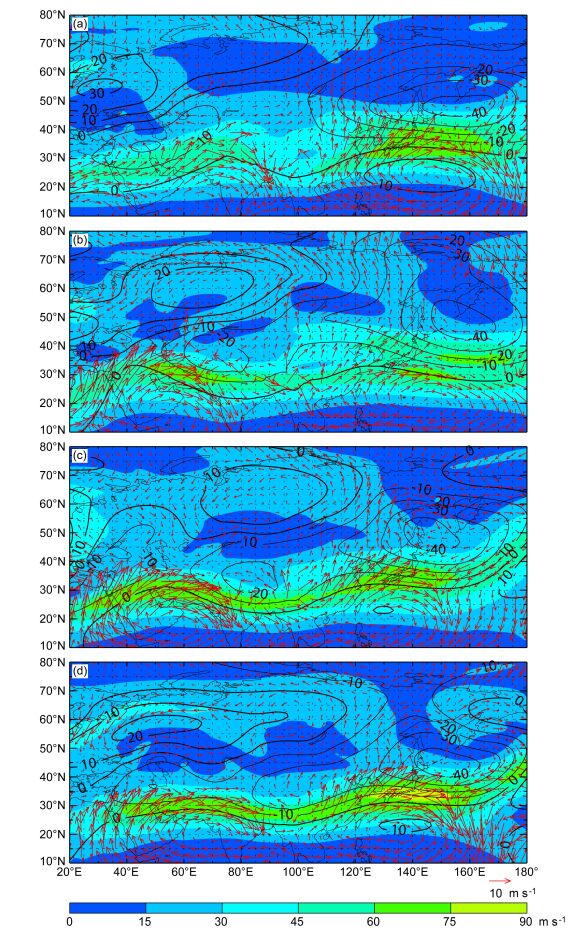
图 7是2008年1月11日至2月2日300 hPa我国南方雨雪冰冻灾害期间4个阶段扰动非地转风、扰动位势和急流的分布。在东亚急流的入口区域(110°E附近),急流引起的扰动非地转经向风是向北的,而在急流的北部地区扰动位势为负(低压),则急流北部地区的非地转扰动位势通量向南,与非地转经向风方向相反,这样一种配置使得位于低压区的弱风区扰动动能向南输送至东亚急流的入口处并在该处辐合。在东亚急流的出口区,非地转风位势通量将东亚急流的扰动动能输送到下游急流中心的入口区域,使下游急流得到发展。同时,我们还注意到热带地区同样有能量输送到东亚急流的入口处,但是比急流北部的弱风区输送的能量明显要小。在中东急流出口(80°E附近)存在明显的向南的扰动非地转风,而在中东急流的北部地区扰动位势为负(低压),则中东急流北部地区的非地转扰动位势通量向北。中东急流与东亚急流之间没有明显的大急流中心的之间的扰动动能非地转风位势输送。
|
图 7 2008年1月11日至2月2日我国南方雨雪冰冻灾害期间300 hPa高空急流(填色,间隔:15 m/s)、扰动非地转风矢量(箭头,单位矢量:10 m/s)和扰动位势(粗、细实线表示正、负扰动位势,间隔:10×102 m2/s2)分布:(a)第一阶段;(b)第二阶段;(c)第三阶段;(d)第四阶段 Fig. 7 Distributions of wind (colored, white thin solid lines, intervals: 15 m/s), ageostrophic wind (vectors, units: 10 m/s), and eddy geopotential (thick and thin black solid lines indicate positive and negative seperately, intervals: 10×102 m2/s2) at 300 hPa in (a) the first stage, (b) the second stage, (c) the third stage, (d) the fourth stage of the snowstorm event in 2008 over southern China. |
本文分析了2008年1月到2月初东亚急流对我国南方雨雪冰冻灾害的影响,并从能量的角度给出了东亚急流变化的可能原因。
东亚急流入口区的垂直运动对我国南方降雨有非常重要的作用。灾害发生的期间,东亚急流增强,引起急流入口区的垂直运动增强,有利于降雨增强,同时低层(700 hPa)急流将南海以及西太平洋上空的暖湿空气源源不断的输送到降雨区域,为降雨提供丰富的水汽。急流的变化除了引起垂直运动增强外,还能引起垂直运动的南北移动和南北范围,使得雨带南北移动及其南北范围的变化。
为了研究灾害发生期间东亚急流变化的原因,本文分析了扰动动能以及对比扰动动能方程中扰动动能的净产生项,结果表明:(1)扰动动能的变化能够很好的表示急流的变化;(2)扰动位势平流对扰动动能的发展至关重要。东亚急流北部弱风区存在较小的扰动动能中心,位势通量矢量将这个中心的扰动动能输送到东亚急流的入口处并在该处辐合,使得东亚急流增强。
另外,扰动有效位能的转换在各个阶段总效应很小,但是不能忽略它的作用,在一天4次的分析中它对扰动动能变化的作用主要位于对流层中层且量级与扰动位势平流项相当。
| [] | Carillo A, Ruti P M, Navarra A. 2000. Storm tracks and zonal mean flow variability:A comparison between observed and simulated data[J]. Climate Dyn., 16: 219–228. DOI:10.1007/s003820050015 |
| [] | Dee D P, Uppala S M, Simmons A J, et al. 2011. The ERA-Interim reanalysis:Configuration and performance of the data assimilation system[J]. Quart. J. Roy. Meteor. Soc., 137: 553–597. DOI:10.1002/qj.828 |
| [] | 高守亭, 陶诗言, 丁一汇. 1992. 寒潮期间高空波动与东亚急流的相互作用[J]. 大气科学, 16(6): 718–724. Gao Shouting, Tao Shiyan, Ding Yihui. 1992. Upper wave-east Asian jet interaction during the period of cold wave outbreak[J]. Chinese Journal of Atmospheric Sciences (in Chinese), 16(6): 718–724. DOI:10.3878/j.issn.1006-9895.1992.06.09 |
| [] | 顾雷, 魏科, 黄荣辉. 2008. 2008年1月我国严重低温雨雪冰冻灾害与东亚季风系统异常的关系[J]. 气候与环境研究, 13(4): 405–418. Gu Lei, Wei Ke, Huang Ronghui. 2008. Severe disaster of blizzard, freezing rain, and low temperature in January 2008 in China and its association with the anomalies of East Asian monsoon system[J]. Climatic and Environmental Research (in Chinese), 13(4): 405–418. DOI:10.3878/j.issn.1006-9585.2008.04.06 |
| [] | Held I M, Hou A Y. 1980. Nonlinear axially symmetric circulations in a nearly inviscid atmosphere[J]. J. Atmos. Sci., 37: 515–533. DOI:10.1175/1520-0469(1980)037<0515:NASCIA>2.0.CO;2 |
| [] | Hou A Y. 1998. Hadley circulation as a modulator of the extratropical climate[J]. J. Atmos. Sci., 55: 2437–2457. DOI:10.1175/1520-0469(1998)055<2437:HCAAMO>2.0.CO;2 |
| [] | 况雪源, 张耀存, 刘健. 2008. 对流层上层副热带西风急流与东亚冬季风的关系[J]. 高原气象, 27(4): 701–712. Kuang Xueyuan, Zhang Yaocun, Liu Jian. 2008. Relationship between subtropical uppertropospheric westerly jet and East Asian winter monsoon[J]. Plateau Meteorology (in Chinese), 27(4): 701–712. |
| [] | Lachmy O, Harnik N. 2014. The transition to a subtropical jet regime and its maintenance[J]. J. Atmos. Sci., 71: 1389–1409. DOI:10.1175/JAS-D-13-0125.1 |
| [] | Lee S, Kim H K. 2003. The dynamical relationship between subtropical and eddy-driven jets[J]. J. Atmos. Sci., 60: 1490–1503. DOI:10.1175/1520-0469(2003)060<1490:TDRBSA>2.0.CO;2 |
| [] | 李崇银, 杨辉, 顾薇. 2008. 中国南方雨雪冰冻异常天气原因的分析[J]. 气候与环境研究, 13(2): 113–122. Li Chongyin, Yang Hui, Gu Wei. 2008. Cause of severe weather with cold air, freezing rain, and snow over South China in January 2008[J]. Climatic and Environmental Research(in Chinese), 13(2): 113–122. DOI:10.3878/j.issn.1006-9585.2008.02.01 |
| [] | Li J, Yu R C, Zhou T J, et al. 2005. Why is there an early spring cooling shift downstream of the Tibetan Plateau?[J]. J. Climate, 18: 4660–4668. DOI:10.1175/JCLI3568.1 |
| [] | Liao Z J, Zhang Y C. 2013. Concurrent variation between the East Asian subtropical jet and polar front jet during persistent snowstorm period in 2008 winter over southern China[J]. J. Geophys. Res., 118: 6360–6373. DOI:10.1002/jgrd.50558 |
| [] | 毛睿, 龚道溢, 房巧敏. 2007. 冬季东亚中纬度西风急流对我国气候的影响[J]. 应用气象学报, 18(2): 137–146. Mao Rui, Gong Daoyi, Fang Qiaomin. 2007. Influences of the East Asian jet stream on winter climate in China[J]. Journal of Applied Meteorological Science (in Chinese), 18(2): 137–146. DOI:10.3969/j.issn.1001-7313.2007.02.002 |
| [] | Murakami S. 2011. Atmospheric local energetics and energy interactions between mean and eddy fields. Part Ⅰ:Theory[J]. J. Atmos. Sci., 68: 760–768. DOI:10.1175/2010JAS3664.1 |
| [] | Orlanski I. 2005. A new look at the Pacific storm track variability:Sensitivity to tropical SSTs and to upstream[J]. J. Atmos. Sci., 62: 1367–1390. DOI:10.1175/JAS3428.1 |
| [] | Orlanski I, Katzfey J. 1991. The life cycle of a cyclone wave in the Southern Hemisphere. Part Ⅰ:Eddy energy budget[J]. J. Atmos. Sci., 48: 1972–1998. DOI:10.1175/1520-0469(1991)048<1972:TLCOAC>2.0.CO;2 |
| [] | Orlanski I, Sheldon J. 1993. A case of downstream baroclinic development over western north America[J]. Mon. Wea. Rev., 121: 2929–2950. DOI:10.1175/1520-0493(1993)121<2929:ACODBD>2.0.CO;2 |
| [] | Ren X J, Zhang Y C, Xiang Y. 2008. Connections between wintertime jet stream variability, oceanic surface heating, and transient eddy activity in the North Pacific[J]. J. Geophys. Res., 113(D21): D21119. DOI:10.1029/2007JD009464 |
| [] | Ren X J, Yang X Q, Chu C J. 2010. Seasonal variations of the synoptic-scale transient eddy activity and polar front jet over East Asia[J]. J. Climate, 23: 3222–3233. DOI:10.1175/2009JCLI3225.1 |
| [] | Ren X J, Yang X Q, Zhou T J, et al. 2011. Diagnostic comparison of wintertime East Asian subtropical jet and polar-front jet:Large-scale characteristics and transient eddy activities[J]. Acta Meteorologica Sinica, 25(1): 21–33. DOI:10.1007/s13351-011-0002-2 |
| [] | Sun J H, Zhao S X. 2010. The impacts of multiscale weather systems on freezing rain and snowstorms over southern China[J]. Wea. Forecasting, 25: 388–407. DOI:10.1175/2009WAF2222253.1 |
| [] | 王东海, 柳崇健, 刘英, 等. 2008. 2008年1月中国南方低温雨雪冰冻天气特征及其天气动力学成因的初步分析[J]. 气象学报, 66(3): 405–422. Wang Donghai, Liu Chongjian, Liu Ying, et al. 2008. A preliminary analysis of features and causes of the snow storm event over the southern China in January 2008[J]. Acta Meteorologica Sinica (in Chinese), 66(3): 405–422. DOI:10.3321/j.issn:0577-6619.2008.03.011 |
| [] | Wang D H, Liu C J, Liu Y, et al. 2009. A preliminary analysis of features and causes of the snow storm event over the southern China in January 2008[J]. Acta Meteorologica Sinica, 23(3): 374–386. |
| [] | Watanabe M. 2004. Asian jet waveguide and a downstream extension of the North Atlantic oscillation[J]. J. Climate, 17: 4674–4691. DOI:10.1175/JCLI-3228.1 |
| [] | Xin X G, Yu R C, Zhou T J, et al. 2006. Drought in late spring of South China in recent decades[J]. J. Climate, 19: 3197–3206. DOI:10.1175/JCLI3794.1 |
| [] | Yang S, Lau K M, Kim K M. 2002. Variations of the East Asian jet stream and Asian-Pacific-American winter climate anomalies[J]. J. Climate, 15: 306–325. DOI:10.1175/1520-0442(2002)015<0306:VOTEAJ>2.0.CO;2 |
| [] | 叶丹, 张耀存. 2014. 冬季东亚副热带急流和温带急流协同变化与我国冷空气活动的关系[J]. 大气科学, 38(1): 146–158. Ye Dan, Zhang Yaocun. 2014. Association of concurrent variation between the East Asian polar front and subtropical jets with winter cold air activity in China[J]. Chinese Journal of Atmospheric Sciences (in Chinese), 38(1): 146–158. DOI:10.3878/j.issn.1006-9895.2013.13110 |
| [] | Yu R C, Zhou T J. 2004. Impacts of winter-NAO on March cooling trends over subtropical Eurasia continent in the recent half century[J]. Geophys.Res. Lett., 31: L12204. DOI:10.1029/2004GL019814 |
| [] | Yu R C, Zhou T J. 2007. Seasonality and three-dimensional structure of interdecadal change in the East Asian monsoon[J]. J. Climate, 20: 5344–5355. DOI:10.1175/2007JCLI1559.1 |
| [] | 张春艳, 张耀存. 2013. 2008年初持续性低温雨雪冰冻事件的东亚高空急流特征[J]. 热带气象学报, 29(2): 306–314. Zhang Chunyan, Zhang Yaocun. 2013. The characteristics of East Asian jet stream in severe snow storm and freezing rain processes over southern china in early 2008[J]. Journal of Tropical Meteorology (in Chinese), 29(2): 306–314. DOI:10.3969/j.issn.1004-4965.2013.02.015 |
| [] | 张耀存, 王东阡, 任雪娟. 2008. 东亚高空温带急流区经向风的季节变化及其与亚洲季风的关系[J]. 气象学报, 66(5): 707–715. Zhang Yaocun, Wang Dongqian, Ren Xuejuan. 2008. Seasonal variation of the meridional wind in temperate jet stream and its relationship to the Asian monsoon[J]. Acta Meteorologica Sinica (in Chinese), 66(5): 707–715. DOI:10.3321/j.issn:0577-6619.2008.05.005 |
| [] | 赵思雄, 孙建华. 2008. 2008年初南方雨雪冰冻天气的环流场与多尺度特征[J]. 气候与环境研究, 13(4): 351–367. Zhao Sixiong, Sun Jianhua. 2008. Multi-scale systems and conceptual model on freezing rain and snow storm over southern China during January-February 2008[J]. Climatic and Environmental Research (in Chinese), 13(4): 351–367. DOI:10.3878/j.issn.1006-9585.2008.04.02 |
 2017, Vol. 22

