2 沈阳中心气象台, 沈阳 110016;
3 中国科学院大学, 北京 100049;
4 中国科学院大气物理研究所季风系统研究中心, 北京 100190
2 Shenyang Meteorological Observatory, Shenyang 110016;
3 University of Chinese Academy of Sciences, Beijing 100049;
4 Center for Monsoon System Research, Institute of Atmospheric Physics, Chinese Academy of Sciences, Beijing 100190
IPCC第五次评估报告指出,全球平均表面温度在1880~2012年升高0.85℃(0.65~1.06 ℃);1951~2012年地表气温增暖的速率是1880年以来的两倍左右。然而理解20世纪气候增暖的机理及演变规律,需要放在近千年气候演变的大背景下(周天军等,2011)。受人类活动影响较小的工业革命前,850~1850年包括两个特征时期:中世纪气候异常期(950~1250年)和小冰期(1450~1850年)。在PAGES(Past Global Changes)和CLIVAR(Climate Variability and Predictability)等国际研究计划的推动下,对近千年气候的演变问题取得了越来越多的成果。
由于20世纪之前气候变化的研究主要基于各种代用资料(如树轮、冰芯、珊瑚、石笋、湖泊沉积物等)重建的气候序列,不同的研究对气候特征期的划分,气温变化幅度等存在较大分歧。近年来,国际上发表了许多利用各种代用资料重建的过去几百年至几千年的全球或半球平均温度序列(Jones et al., 1998;Mann et al., 1999;Briffa,2000;Crowley,2000;Huang,2004)。为了对近千年气候变化的特征和机理有进一步的认识,近年来人们利用各种复杂程度的气候模式对近千年气候进行了模拟(Crowley,2000;Goosse et al., 2005;Zorita et al., 2005;Ammann et al., 2007;Servonnat et al., 2010;Liu et al., 2011)。由于重建的外强迫数据的不确定性,模式敏感度不同等因素,模拟结果之间差别很大(Fernández-Donado et al., 2013)。
大气涛动是控制区域气候变化的主要环流机制,研究大气涛动变化有助于认识区域气候变化特征,近年来大气涛动研究的一个新进展就是利用各种代用资料重建过去几百年到千年的大气涛动序列(黄建斌等,2010)。模拟结果与重建资料的比较,将丰富我们对近千年气候演变过程和机制的认识(周天军等,2009)。
季风是大气—陆地—海洋系统对太阳辐射强迫年变化的响应(Wang et al., 2011),是大气环流的重要组成部分,是全球性环流现象。传统的季风概念为大范围地区盛行风向的季节性反转,属于区域性现象。但随着人们对季风认识的不断深入以及卫星遥感等新技术的应用,开始从全球角度研究季风的多时间尺度变化。Trenberth et al.(2000)通过分析风场,提出全球季风是全球尺度大气环流随季节而变化的持续性翻转,强调太阳辐射年循环所引起的全球范围海陆热力对比所导致的环流变化。关于全球季风范围和降水变化等相关研究已取得了很多成果(Wang and Ding, 2006,2008;Zhou et al., 2008;Hsu et al., 2012;曹剑,2015)。Liu et al.(2009)利用海—气耦合模式ECHO-G的模拟结果发现近千年全球季风降水存在准200年的周期,全球季风最弱的时期与太阳活动的最小期对应。Liu et al.(2012)认为过去千年全球季风降水百年尺度变化在各季风区域相同,是对外强迫的响应,而全球季风多年代际尺度变化则代表了内部变率,各季风区域变化不同。然而,此前的研究并没有从环流角度讨论全球季风百年到千年尺度变化。本文将首先分析模式对百年尺度气候变率的模拟能力,并与重建数据作比较,最后讨论全球季风百年到千年尺度变化。
2 模式与数据ICM(Integrated Climate Model)是中国科学院大气物理研究所季风系统研究中心自2008年开始应用的一个大气—海洋—海冰耦合模式,不采用通量订正方案。其中,大气分量模式为德国马普气象研究所(Max Planck Institute for Meteorology)开发的大气环流模式ECHAM5(Roeckner et al., 2003),水平分辨率为T31,约3.75°(纬度)×3.75°(经度),垂直分辨率为19层。海洋分量模式是法国LODYC(Laboratoire d’Océanographie Dynamique et de Climatologie)开发的全球海洋—海冰耦合环流模式NEMO2.3(Nucleus for European Modelling of the Ocean)(Madec,2008),包括海洋模式OPA9(Ocean Parallelism version 9)和海冰模式LIM2(Louvain-la-Neuve Ice Model version 2),水平分辨率高纬度大约为2°,赤道附近加密到0.5°,采用了移极不规则网格,避免了北极点处的计算问题,垂直方向分为31层,最深为5250.23 m,其中100 m以上有10层。耦合器是OASIS3.0,已应用于多种耦合模式中(Valcke,2006)。整体耦合方案参考了欧盟PRISM计划提出的COSMOS地球系统模式耦合框架(Legutke and Gayler, 2005),与KCM(Kiel Climate Model)和SINTEX耦合方案相似(Gualdi et al., 2003;Luo et al., 2005)。关于该模式的介绍,详见文献Wang(2014)和Huang et al.(2014)。
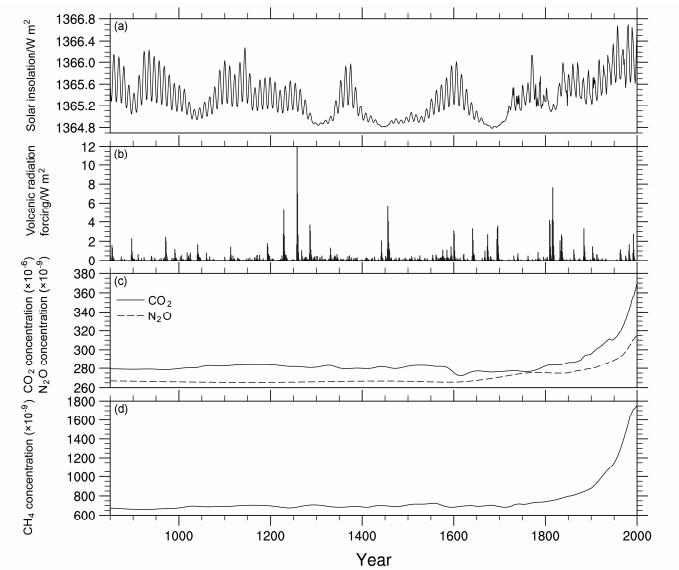
本文进行了两组试验,工业革命前气候控制试验与近千年气候外强迫试验。控制试验中固定太阳常数等外强迫场为1850年的值。近千年试验分为两步,首先将外强迫场固定为850年的值进行积分600年,100 m以上的海洋温度达到了稳定状态,然后利用600年的值作为初始状态完成851~2000年的积分。此时外强迫场是随时间变化的太阳辐射常数、火山活动和温室气体(包括CO2、CH4和N2O)。外强迫场数值的时间演变如图 1。
|
图 1 850~2000年驱动气候模式的外强迫时间演变序列:(a)太阳辐照度;(b)火山辐射强迫(×−1);(c)CO2浓度(实线)、N2O浓度(虚线);(d)CH4浓度 Fig. 1 External forcing used in ICM (Integrated Climate Model) forced run: (a) Solar insolation; (b) volcanic radiation forcing (multiply by −1); (c) the concentrations of CO2 (solid line) and N2O (dashed line); (d) the concentration of CH4 |
过去的研究认为蒙德尔极小期(Maunder Minimum)太阳辐照度比现代太阳活动低值期(11年周期低值年)低0.2%~0.4%,近来越来越多的研究认为比现代平均太阳辐照度减少0.1%左右(Schmidt et al., 2012)。本文中850~1849年太阳辐射强迫场使用Vieira et al.(2011)基于同位素(如10Be)的重建序列,1850~2000年为Wang et al.(2005)根据历史上长期的太阳黑子观测记录重建的太阳辐照度序列,从蒙德尔极小期到现代太阳辐照度增加0.1%。火山强迫采用Crowley and Unterman(2013)气溶胶光学厚度(AOD)和有效半径(Reff),并转换为辐射效应时间序列(Crowley,2000),没有考虑火山气溶胶不同纬度的变化(Gao et al., 2008)。模拟中火山活动的辐射效应已转换为太阳辐照度的变化,有效辐射为太阳辐照度与火山辐射强迫的和。过去千年温室气体(CO2、CH4和N2O)浓度的演变是基于南极大陆高分辨率冰芯(Schmidt et al., 2012)。
为验证模式结果,本文所使用的观测资料:CMAP(CPC Merged Analysis of Precipitation)逐月降水率(Xie and Arkin, 1997),资料长度均为1979~2008年,空间分辨率2.5°(纬度)×2.5°(经度)。为了与模拟数据进行对比,利用双线性插值方法将降水观测场插值到模拟场的格点上。
本文中使用的重建资料如下。利用北半球高纬度树木年轮资料重建的温度时间序列(Briffa,2000;D'Arrigo et al., 2006)。由于气候代用资料各有利弊,综合使用各种代用资料(如树木年轮、珊瑚、冰芯等)重建的南、北半球温度(Jones et al., 1998;Mann et al., 1999, 2008;Crowley,2000;Mann and Jones, 2003;Huang,2004;Ammann and Wahl, 2007)。Mann et al.(2009)基于多种代用资料重建的全球表面温度,以及由此得出的Nino3、PDO(Pacific Decadal Oscillation)和AMO(Atlantic Multidecadal Oscillation)指数序列。MacDonald and Case(2005)利用北美西南部和加拿大地区的树木年轮重建的PDO序列。Trouet et al.(2009)利用摩洛哥树木年轮和苏格兰石笋重建的NAO(North Atlantic Oscillation)序列。Cook et al.(2002)利用北美东部、欧洲、北非树木年轮和格陵兰冰芯重建的NAO序列。Glueck and Stockton(2001)利用摩洛哥和芬兰树木年轮重建的NAO序列。Gray et al.(2004)利用北美东部和欧洲树木年轮重建的AMO序列。
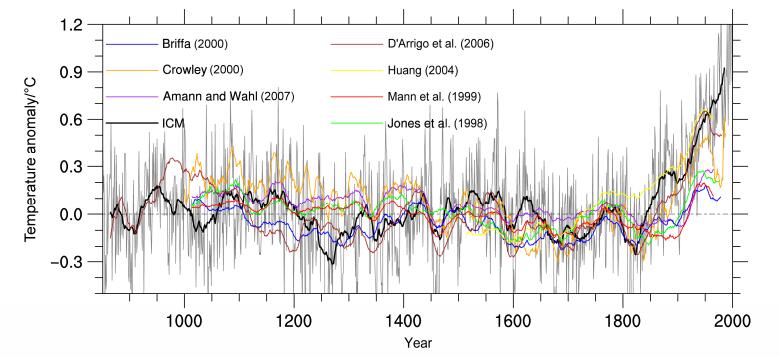
3 表面温度的千年演变模拟的北半球、南半球平均表面温度都呈现出了1800年代至2000年的快速增暖(图 2、图 3)。从1850年到2000年北半球平均表面温度大约升高1.0 ℃,南半球升高0.5 ℃。由于南半球海洋覆盖面积较广,其温度变化幅度要比北半球小(图 3)。20世纪南、北半球分别大约增温0.4 ℃、0.8 ℃,与器测资料接近。表面温度在13世纪末、15世纪中期、18世纪末有大幅度的下降,这正是大的火山爆发的时期。中世纪气候异常期(1000~1250年)表面温度的最大值比19世纪初期高大约0.4 ℃,这与许多重建序列相符(图 2)。D'Arrigo et al.(2006)重建的北半球温度在12世纪到14世纪、17世纪有大幅度的下降,模拟结果中并没有出现,Rutherford et al.(2005)指出这可能是因为代用资料中赤道外树木年轮空间分布的局限性。同样,13世纪中期到19世纪中期小幅度的温度变化(Jones et al., 1998;Ammann and Wahl, 2007)也与模式模拟结果不符。由于利用代用资料反演气候变化的工作大部分集中于北半球中高纬地区的温度变化上,南半球的代用资料序列很少且不确定性较大,使得对南半球近千年气候变化缺少细致的探讨(况雪源等,2008)。已发表的南半球表面温度重建序列相较于北半球数量较少,并在850~1850年与模式模拟的温度变化幅度基本一致。
|
图 2 北半球平均表面温度距平,黑线为ICM模拟结果,彩色线为基于代用资料的重建序列。以上结果分别减去了其1500~1899年平均值,所有数据均进行了30年滑动平均(灰色线为ICM模拟的表面温度距平,且未经过滑动平均) Fig. 2 Surface temperature anomalies over the Northern Hemisphere. The simulated time series is plotted in black. Proxy-based reconstruction of the Northern Hemisphere temperature variation is shown in color. All are shown as anomalies relative to the 1500-1899 mean, 30-year moving average is applied to all the data. Originally simulated annual mean temperature is shown by the gray line |

|
图 3 同图 2,但为南半球平均表面温度距平 Fig. 3 Same as Fig. 2, but for surface temperature anomalies over the Southern Hemisphere |
为了揭示不同特征期温度变化的空间分布,ICM模拟的中世纪气候异常期(MWP)与小冰期(LIA)表面温度气候平均态差值的空间分布如图 4所示。由于极地冰雪的正反馈机制,高纬度增温幅度更大,即“极地强化”现象(Holland and Bitz, 2003)。在南北半球的冬季,变暖的极值都在极区。总的来说,MWP比LIA更暖,冬季表面温度极地强化现象与MWP海冰的减少有关。

|
图 4 模拟的MWP(中世纪气候异常期,1000~1250年)与LIA(小冰期,1600~1800年)表面温度气候平均态的差值(黑点表示通过了0.05的显著性检验):(a)冬季;(b)夏季 Fig. 4 Climatological surface temperature difference between simulations for MWP (defined as 1000−1250) and LIA (defined as 1600−1800) (MWP minus LIA): (a) Winter (DJF); (b) summer (JJA). Areas stippled in black indicate significance at the level of 0.05 |
图 5为模式模拟与Mann et al.(2009)重建MWP与LIA表面温度差值对比图。“极地强化”现象模式模拟和重建结果中均有体现。Mann et al.(2009)重建的温度距平在北美西北部、冰岛为极大值区。重建结果要比模拟增温强度大得多。其中,重建结果赤道中东太平洋显著变冷,模式模拟中赤道东太平洋没有显著的变冷。这种La Ni a-like的模态在一些代用资料中有显示(Graham et al., 2011),目前大多数全球海气耦合模式均难以再现上述特征,例如CCSM4气候系统模式(Landrum et al., 2013)和FGOALS气候模式(Man and Zhou, 2014)。

|
图 5 MWP(1000~1250年)与LIA(1600~1800年)年平均表面温度气候平均态的差值(黑点表示通过了0.05的显著性检验):(a)ICM模拟;(b)Mann et al.(2009)基于代用资料的重建结果 Fig. 5 Annual mean surface temperature difference between simulations for MWP (defined as 1000−1250) and LIA (defined as 1600−1800) (MWP minus LIA): (a) Simulation of ICM; (b) proxy-based reconstruction (Mann et al., 2009). Areas stippled in black indicate significance at the level of 0.05 |
大气涛动是控制区域气候变化的主要环流机制,研究大气涛动变化有助于认识区域气候变化特征。本节将千年模拟试验大气涛动与控制试验做对比,并且将模拟的指数与重建的指数进行比较。
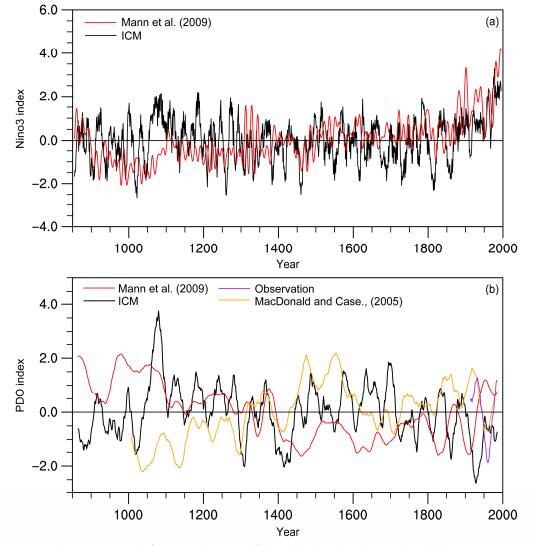
ENSO是一种周期为2~7年,赤道太平洋海—气相互作用的一个海—气耦合系统,对全球范围的气候有重要影响(Alexander et al., 2002)。本文中Nino3指数为(5°S~5°N,150°W~90°W)海表面温度距平(减去长期平均值)的区域平均。如图 6a所示,近千年模拟试验与控制试验功率谱相似,近千年试验的结果相对控制试验方差略大。Mann et al.(2009)重建的过去千年Nino3指数序列中(图 7),MWP期间盛行La Ni a-like模态,LIA期间盛行El Ni o-like模态,模拟结果中不同特征期ENSO的位相没有显著变化。Mann et al.(2005)对重建资料中显示的ENSO型海温提出了动力反馈机制,由于目前大多数全球海气耦合模式对这种物理机制刻画较弱,难以再现上述特征(满文敏和周天军,2011)。

|
图 6 ICM模拟的(a)Nino3、(b)PDO、(c)AMO、(d)NAO指数的功率谱分析(黑线是近千年试验的结果,蓝线是控制试验的结果),虚线表示95%的置信水平 Fig. 6 Spectra of the modes of (a) Nino3, (b) PDO (Pacific Decadal Oscillation), (c) AMO (Atlantic Multidecadal Oscillation), and (d) NAO (North Atlantic Oscillation) indexes for the last millennium run (black) and the control run (blue). Dashed line indicates the 95% confidence level |
太平洋年代际振荡(PDO)是一种年代际时间尺度上的气候变率强信号(Mantua et al., 1997)。模拟的PDO指数是北太平洋(20°N~70°N)SST距平EOF分析第一模态的标准化时间系数。无论是近千年模拟试验还是控制试验,PDO波谱图中在10年左右有一个峰值,这与观测相一致;40年和60年左右的极大值也相似。近千年试验的结果相对控制试验方差略大,表明外强迫对PDO的调制作用,这与CCSM4的结果不同(Landrum et al., 2013)。PDO指数(MacDonald and Case, 2005;Mann et al., 2009)重建序列彼此相差较大(图 7),且与模拟的PDO指数之间相关性均较小。满文敏和周天军(2011)FGOALS_gl模拟的PDO指数在MWP期间为负位相,LIA期间正位相,Landrum et al.(2013)CCSM4的模拟结果则表明MWP与LIA相比,PDO没有显著的差异,模拟结果之间以及重建资料之间的差异表明PDO指数变化与动力机制有关,还需要进一步的研究来说明这种差异产生的原因(Landrum et al., 2013)。
|
图 7 ICM模拟与重建的(a)Nino3与(b)PDO指数序列(黑线为ICM模拟,彩色线为代用资料重建)。其中Nino3、PDO指数经过了标准化。PDO序列均经过30年滑动平均,Nino3经过10年滑动平均 Fig. 7 Time series of the (a) Nino3 and (b) PDO indexes in the last millennium simulation (shown in black line) and proxy-based reconstructions (shown in colors). The PDO index and Nino3 index are first smoothed using 30-year and 10-year moving averages, respectively, and then normalized |
|
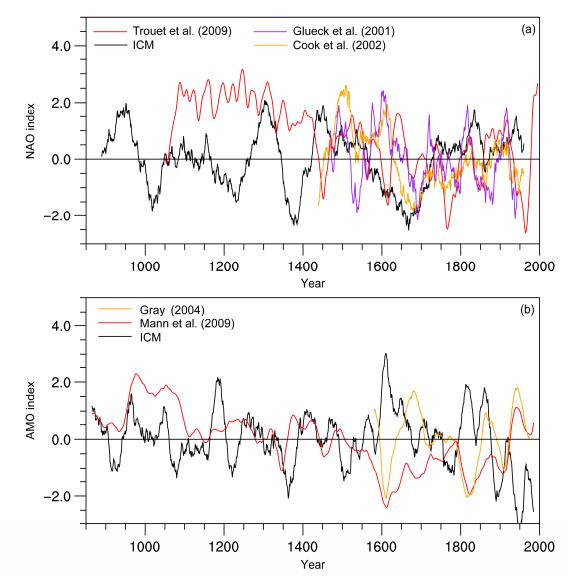
图 8 ICM模拟与重建的(a)NAO与(b)AMO指数序列(黑线为ICM模拟,彩色线为代用资料重建)。其中NAO和AMO指数均经过了标准化,所有序列均经过30年滑动平均 Fig. 8 Time series of the (a) NAO and (b) AMO indexes in the last millennium simulation (shown in black line) and proxy-based reconstructions (shown in colors). Annual NAO and AMO time series are fist smoothed using 30-year moving average and then standardized |
北大西洋年代际振荡(AMO)是北大西洋区域海表面温度60~80年的准周期涛动。研究表明,AMO与北美大陆、西非以及南亚的降水,欧亚大陆的表面温度,大西洋飓风的强度等存在密切关系(李双林等,2009)。模拟的AMO指数是北大西洋区域(0°~70°N,90°W~40°E)平均SST(去掉了全球趋势的影响)。由图 6c可见,AMO指数在多年代际尺度上存在峰值,并且超过了95%的置信水平。近千年试验与控制试验的方差比较吻合。Gray et al.(2004)根据北美和欧洲的树木年轮,与Mann et al.(2009)基于多种代用资料重建的AMO指数之间存在很大的差异。Mann et al.(2009)重建序列与Landrum et al.(2013)的模拟结果显示在中世纪气候异常期AMO指数处于持续正位相,而ICM模拟结果并没有这种趋势。
北大西洋涛动(NAO)是大西洋地区大气活动的主要模态,反映了冰岛低压和亚速尔高压之间的反向变化,对整个大西洋地区甚至是北半球气候都有重要影响(Zhou et al., 2000)。模拟的NAO指数为冬季(12月至次年3月)北大西洋区域(20°N~80°N,90°W~40°E)海平面气压EOF分析第一模态。NAO谱分析图中存在准3年和5~6年左右的峰值,并且超过了95%的置信水平(图 6d)。根据树木年轮、冰芯同位素、物候学资料等重建的近千年NAO序列(Glueck and Stockton, 2001;Cook et al., 2002;Trouet et al., 2009),在1500~2000年,各种重建序列比较一致,但在年代际到多年代际尺度上相差较大,这与Cook et al.(2002)利用多种代用资料得出的结果相同,而ICM模拟的NAO指数功率谱分析也表明其在年代际尺度上没有显著的峰值。模拟的NAO指数在1900~2000年与重建序列一致性较好,然而Trouet et al.(2009)重建的NAO指数在MWP期间为持续正位相,ICM以及CCSM4(Landrum et al., 2013)和FGOALS_gl(满文敏和周天军,2011)均未模拟出这种特征,原因可能是西欧与北非降水遥相关的不稳定性(Landrum et al., 2013)。
5 全球季风 5.1 模式模拟能力检验在分析全球季风百年尺度变化之前,需要首先验证模式对全球季风的模拟能力。本文根据Wang and Ding(2008)提出的全球季风模拟3个评价标准,即年平均降水率,两个降水年循环模态和降水强度、季风区域范围,对模式的模拟能力进行检验。
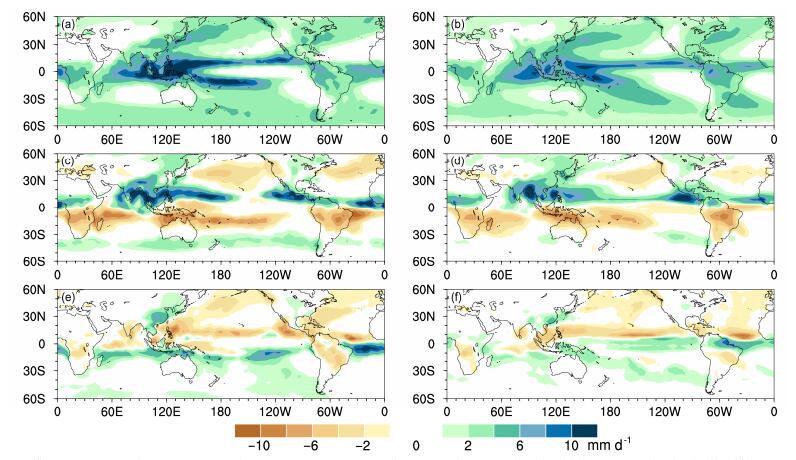
如图 9a和9b,模式模拟与观测(CMAP)的年平均降水率空间分布相比较,模式较合理地再现了全球年平均降水的主要分布特征。能够模拟出降水的大值区:热带辐合带(ITCZ)、副热带太平洋和大西洋。对副热带干旱地区的模拟也较好。模式最大的模拟偏差在于对ITCZ的模拟,在热带太平洋和东印度洋上,模式模拟的降水明显高于观测资料。总的来说,模式较好的模拟出了年平均降水率的空间分布,为了定量地评估模式模拟的降水空间型与观测的相近程度,计算出(60°N~60°S,0°~360°E)模拟值与观测资料的空间相关系数PCC(Pattern Correlation Coefficient)为0.89。
|
图 9 模拟(1979~2000年,左列)和观测资料(CMAP)(1979~2008年,右列)的(a、b)年平均降水率、(c、d)降水年循环第一模态(至日点模态)和(e、f)降水年循环第二模态(春秋非对称模态) Fig. 9 Comparison of precipitation climatology between simulation (1979−2000, left column) and observations (CMAP) (1979−2008, right column): (a, b) Annual mean precipitation rate; (c, d) the first annual cycle mode (solstice mode); (e, f) the second annual cycle mode (equinoctial asymmetric mode) |
图 9 c和9d为模拟和观测的至日点模态,计算方法是6~9月(JJAS)和12月到第二年3月(DJFM)平均降水的差值。从图中可以看到,模式能够模拟出至日点模态降水关于赤道的反对称特征,合理地再现了亚洲、西非、北美的正值区,南非、南美和澳大利亚的负值区。模拟的主要偏差是西北太平洋和西南太平洋降水模态过于东伸。(60°N~60°S,0°~360°E)模拟值与观测资料至日点模态的空间相关系数为0.74。图 9 e和9f是模拟和观测的降水年循环第二模态—春秋非对称模态,是用4、5月(AM)和10、11月(ON)的平均降水值之差来表示。由图可见,模式能模拟出太平洋和大西洋地区南北半球反位相变化特征,但也存在明显偏差,模拟值相对观测值普遍偏大。模拟与观测的春秋非对称模态空间相关系数为0.55。
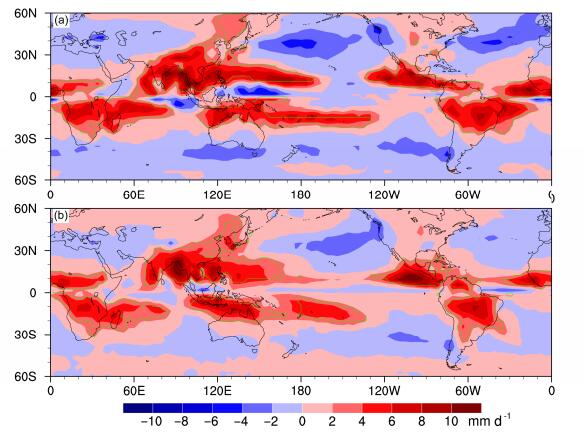
根据Lee and Wang(2014)的定义,给出了与图 9同时间段模拟和观测的降水年较差和季风区范围分布图(图 10),从图中可以看到模式能较好地模拟出降水年较差的主要空间分布特征,空间相关系数达到0.74。模式模拟的全球季风区包括南亚、东亚—西北太平洋、西非、北美、澳大利亚、南美、南非,与观测相近,但也存在明显的偏差,西北太平洋季风区范围过于东伸。
|
图 10 模拟与观测的降水年较差(填色)和全球季风区范围(绿色线中的区域):(a)模拟(1979~2000年);(b)观测资料(CMAP)(1979~2008年) Fig. 10 Annual precipitation range (colored) and the global monsoon domain (outlined by the green contour): (a) Simulation (1979−2000); (b) observations (CMAP) (1979−2008) |
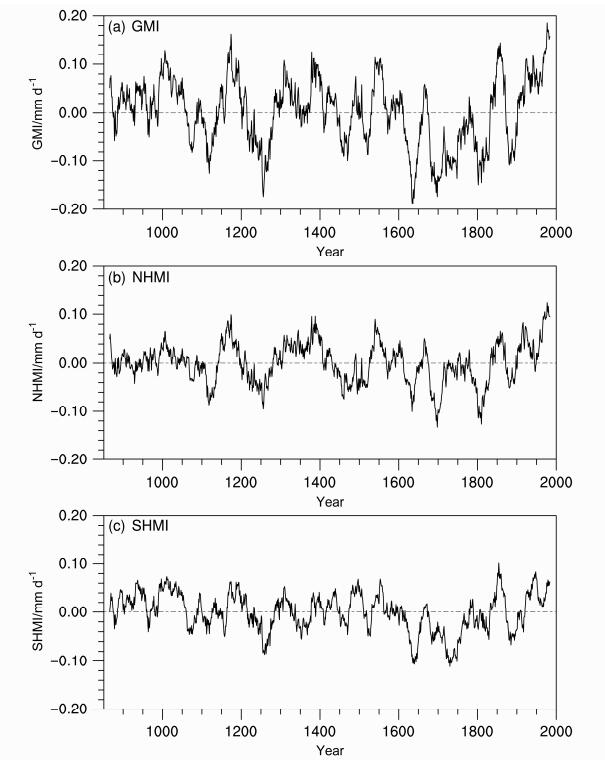
季风强度定义为南北半球夏季平均季风降水率,北半球季风指数(NHMI)定义为6~8月(JJA)北半球季风区(观测)平均降水率,南半球季风指数(SHMI)为12月至第二年2月(DJF)南半球季风区(观测)平均降水率,全球季风指数(GMI)定义为南、北半球季风指数的和,即GMI=NHMI+ SHMI。图 11为近千年模拟试验中30年滑动平均全球季风指数、北半球季风指数和南半球季风指数的时间序列,均呈现出显著的百年尺度变化。全球季风在850~1050年、1150~1200年和1300~1420加强,并大约在1100年、1170年和1400年达到最大值。在1210~1300年和1600~1850年减弱,在1260年、1640年、1700年和1800年达到最小值,值得注意的是,1258年为强火山爆发年,而1700年和1800年分别发生在两个太阳黑子活动极小期:蒙德尔极小期(Maunder Minimum,1645~1715年)和道尔顿极小期(Dalton Minimum,1790~1820年),同时这两个时期火山活动也增加,可见火山和太阳活动是造成全球季风百年尺度变化的重要原因(Liu et al., 2009)。1875~2000年全球季风指数呈直线上升趋势,由于没有考虑气溶胶的作用,模式高估了全球季风的增加趋势。这一时期全球季风的加强与太阳辐照度升高和温室气体的增加有关(Liu et al., 2009)。
|
图 11 模拟的季风指数序列:(a)全球季风指数(GMI);(b)北半球季风指数(NHMI);(c)南半球季风指数(SHMI)。所有数据均进行了30年滑动平均 Fig. 11 Time series of 30-year moving averages of monsoon indexes: (a) Global monsoon index (GMI); (b) the Northern Hemispheric monsoon index (NHMI); (c) the Southern Hemispheric monsoon index (SHMI) |
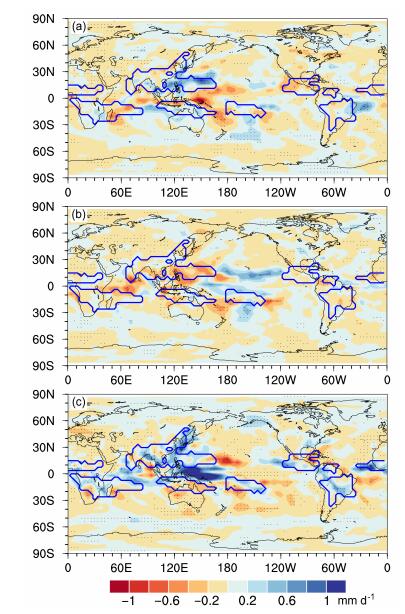
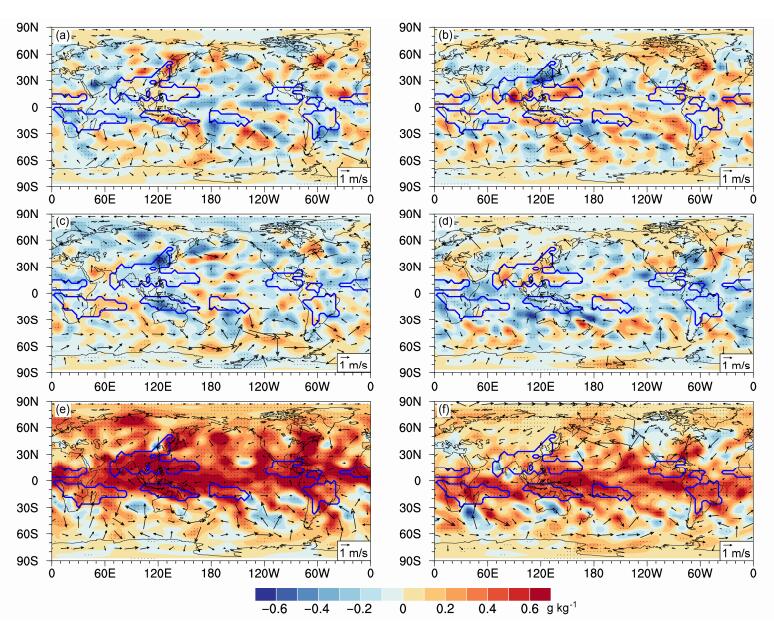
图 12给出了MWP(1171~1200年)、LIA(1685~1714年)和PWP(1971~2000年)全球季风降水距平(相对850~2000年)空间分布,北半球季风降水定义为6~8月(JJA)平均降水率,南半球季风降水定义为12月到第二年2月(DJF)平均降水率。MWP季风强度在全球大部分季风区域增加,但是只有西北太平洋季风区通过了0.05的显著性检验。LIA则相反,季风强度在全球大部分季风区减弱。PWP全球季风强度显著增加,其中赤道西太平洋增加超过1 mm/d,而此区域MWP时期降水率减小0.2~1 mm/d。这是由于PWP时期水汽通量在赤道西太平洋辐合,有利于水汽的垂直输送,降水增加;相反,在MWP时期水汽辐散,抑制了水汽的垂直输送,降水减少(图 13)。
|
图 12 全球季风降水距平:(a)MWP(1171~1200年);(b)LIA(1685~1714年);(c)PWP(20世纪增暖期,1971~2000年)。北半球季风降水定义为JJA平均降水率,南半球季风降水定义为DJF平均降水率,蓝线中的区域为由观测资料(CMAP)得出的季风区,黑点表示通过0.05的显著性检验的区域 Fig. 12 Global monsoon precipitation anomalies: (a) MWP (1171-1200); (b) LIA (1685−1714); (c) PWP (1971−2000). Global monsoon precipitation is defined as JJA (DJF) mean for the Northern (Southern) Hemisphere, and global monsoon domain (outlined by the blue contour) is obtained based on observation (CMAP). Regions stippled in black indicate significance at the level of 0.05 |
|
图 13 北半球夏季(JJA,左列)和冬季(DJF,右列)850 hPa比湿场(填色)和风场(矢量)变化:(a、b)MWP(1171~1200年);(c、d)LIA(1685~1714年);(e、f)PWP(1971~2000年)。蓝线中的区域为由观测资料(CMAP)得出的季风区,黑点表示通过置信度0.05的显著性检验的区域 Fig. 13 Changes in 850-hPa specific humidity (colored) and 850-hPa winds (vectors) for boreal summer (JJA) and winter (DJF): (a, b) MWP (1171−1200); (c, d) LIA (1685−1714); (e, f) PWP (1971−2000). Global monsoon domain (outlined by the blue contour) is obtained based on observation (CMAP), regions stippled in black indicate significance at the level of 0.05 |
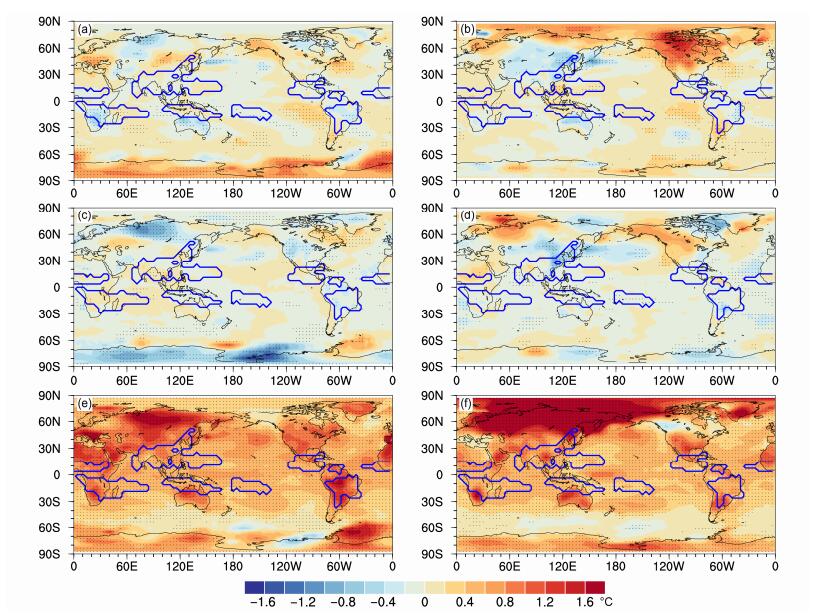
工业革命前有效太阳辐射的变化和20世纪温室气体的增加使得北半球夏季和冬季温度发生了显著的变化(图 14),使得海陆热力对比改变从而导致了全球季风百年到千年尺度变化。在MWP北半球夏季和冬季陆地增温幅度略大于海洋,海陆对比加大,全球季风有所加强。而在LIA陆地降温幅度略大于海洋,全球季风有所减弱。在现在增暖期,夏季温度变化增温幅度强于海洋,造成陆地与海洋热力对比,并且北半球增温幅度大于南半球,南北半球热力对比加大,全球季风加强。
|
图 14 北半球夏季(JJA,左列)和冬季(DJF,右列)表面温度距平:(a、b)MWP(1171~1200年);(c、d)LIA(1685~1714年);(e、f)PWP(1971−2000年)。蓝线中的区域为由观测资料(CMAP)得出的季风区,黑点表示通过置信度0.05的显著性检验的区域 Fig. 14 Surface temperature anomalies for boreal summer and winter: (a, b) MWP (1171−1200); (c, d) LIA (1685−1714); (e, f) PWP (1971−2000). Global monsoon domain (outlined by the blue contour) is obtained based on observation (CMAP), regions stippled in black indicate significance at the level of 0.05 |
本文利用中国科学院大气物理研究所季风系统研究中心发展的耦合模式ICM,选用外强迫场(太阳辐照度、火山活动和温室气体)开展了过去千年气候模拟试验。文中就模式对温度以及主要大气涛动的模拟进行了分析,并讨论了全球季风在百年到千年尺度上的变化,主要结论如下:(1)模拟的北半球、南半球平均表面温度都呈现出了1800~2000年的快速增暖,1850~2000年北半球平均表面温度大约升高1.0 ℃,南半球升高0.5 ℃。模式模拟的20世纪末表面温度与中世纪气候异常期相比,要高很多。MWP表面温度的最大值比19世纪初期高大约0.4 ℃。
(2)近千年试验的结果相对控制试验Nino3指数方差略大,表明外强迫使ENSO的大小有小幅度的增加。PDO功率谱图中,4年左右和10年左右各有一个峰值,与观测相一致。AMO指数在多年代际尺度上存在峰值,并且超过了0.05的置信水平。重建序列在中世纪气候异常期AMO指数处于持续正位相,而模式结果并没有这种趋势。NAO谱分析图中存在准3年、5~6年左右的峰值。重建的近千年NAO指数,MWP近350年的时段里NAO是持续的正位相,模式并没有重现。
(3)全球季风指数、北半球季风指数和南半球季风指数均存在显著的百年尺度变化。全球季风在850~1050年、1150~1200年和1300~1420年加强,在1210~1300年和1600~1850年减弱,在1260年、1640年、1700年和1800年达到最小值,与强火山爆发和两个太阳黑子活动极小期相对应。MWP季风强度在全球大部分季风区域增加,但是只有西北太平洋季风区通过了0.05的显著性检验。LIA则相反,季风强度在全球大部分季风区减弱。PWP全球季风强度显著增加,其中赤道西太平洋增加超过1 mm/d,而此区域MWP时期降水率减小0.2~1 mm/d。这是由于PWP时期水汽通量在赤道西太平洋辐合,有利于水汽的垂直输送,降水增加;相反,在MWP时期水汽辐散,抑制了水汽的垂直输送,降水减少。
从全球角度研究季风的多时间尺度变化可以更好的理解现代季风气候,对于预估未来全球季风变化有重要意义。此前的研究多关注季风年际和年代际尺度变化,对近千年全球季风百年尺度变化研究较少,本文对全球季风在百年到千年尺度上的变化进行了讨论。后续将利用耦合模式ICM开展轨道尺度全球季风变化的研究,探讨岁差和地轴倾角对全球季风强度和区域面积的相对作用。
| [] | Alexander M A, Bladé I, Newman M, et al. 2002. The atmospheric bridge:The influence of ENSO teleconnections on air-sea interaction over the global oceans[J]. J. Climate, 15(16): 2205–2231. DOI:10.1175/1520-0442(2002)015<2205:TABTIO>2.0.CO;2 |
| [] | Ammann C M, Wahl E R. 2007. The importance of the geophysical context in statistical evaluations of climate reconstruction procedures[J]. Climatic Change, 85(1-2): 71–88. DOI:10.1007/s10584-007-9276-x |
| [] | Ammann C M, Joos F, Schimel D S, et al. 2007. Solar influence on climate during the past millennium:Results from transient simulations with the NCAR Climate System Model[J]. Proceedings of the National Academy of Sciences of the United States of America, 104(10): 3713–3718. DOI:10.1073/pnas.0605064103 |
| [] | Briffa K R. 2000. Annual climate variability in the Holocene:Interpreting the message of ancient trees[J]. Quaternary Science Reviews, 19(1-5): 87–105. DOI:10.1016/S0277-3791(99)00056-6 |
| [] | 曹剑. 2015. NUIST地球系统模式研发及对末次盛冰期全球季风活动的模拟[D]. 南京信息工程大学博士学位论文, 131pp. Cao Jian. 2015. The development of NUIST earth system model and simulation of global monsoon activities during Last glacial maximum[D]. Ph. D. dissertation (in Chinese), Nanjing University of Information Science & Technology, 131pp. |
| [] | Cook E R, D'Arrigo R D, Mann M E. 2002. A well-verified, multiproxy reconstruction of the winter North Atlantic Oscillation index since AD 1400[J]. J. Climate, 15(13): 1754–1764. DOI:10.1175/1520-0442(2002)015<1754:AWVMRO>2.0.CO;2 |
| [] | Crowley T J. 2000. Causes of climate change over the past 1000 years[J]. Science, 289(5477): 270–277. DOI:10.1126/science.289.5477.270 |
| [] | Crowley T J, Unterman M B. 2013. Technical details concerning development of a 1200 yr proxy index for global volcanism[J]. Earth System Science Data, 5(1): 187–197. DOI:10.5194/essd-5-187-2013 |
| [] | D'Arrigo R, Wilson R, Jacoby G. 2006. On the long-term context for late twentieth century warming[J]. J. Geophys. Res.-Atmos., 111(D3): D03103. DOI:10.1029/2005JD006352 |
| [] | Fernández-Donado L, González-Rouco J F, Raible C C, et al. 2013. Large-scale temperature response to external forcing in simulations and reconstructions of the last millennium[J]. Climate of the Past, 9(1): 393–421. DOI:10.5194/cp-9-393-2013 |
| [] | Gao C C, Robock A, Ammann C. 2008. Volcanic forcing of climate over the past 1500 years:An improved ice core-based index for climate models[J]. J. Geophys. Res.-Atmos., 113(D23): D23111. DOI:10.1029/2008JD010239 |
| [] | Glueck M F, Stockton C W. 2001. Reconstruction of the North Atlantic Oscillation, 1429-1983[J]. International Journal of Climatology, 21(12): 1453–1465. DOI:10.1002/joc.684 |
| [] | Goosse H, Crowley T J, Zorita E, et al. 2005. Modelling the climate of the last millennium:What causes the differences between simulations?[J]. Geophys. Res. Lett., 32(6): L06710. DOI:10.1029/2005GL022368 |
| [] | Graham N E, Ammann C M, Fleitmann D, et al. 2011. Support for global climate reorganization during the "Medieval Climate Anomaly"[J]. Climate Dyn., 37(5-6): 1217–1245. DOI:10.1007/s00382-010-0914-z |
| [] | Gray S T, Graumlich L J, Betancourt J L, et al. 2004. A tree-ring based reconstruction of the Atlantic Multidecadal Oscillation since 1567 A.D.[J]. Geophys. Res. Lett., 31(12): L12205. DOI:10.1029/2004GL019932 |
| [] | Gualdi S, Navarra A, Guilyardi E, et al. 2003. Assessment of the tropical Indo-Pacific climate in the SINTEX CGCM[J]. Annals of Geophysics, 46(1): 1–26. DOI:10.4401/ag-3385 |
| [] | Holland M M, Bitz C M. 2003. Polar amplification of climate change in coupled models[J]. Climate Dyn., 21(3-4): 221–232. DOI:10.1007/s00382-003-0332-6 |
| [] | Hsu P C, Li T, Luo J J, et al. 2012. Increase of global monsoon area and precipitation under global warming:A robust signal?[J]. Geophys. Res. Lett., 39(6): L06701. DOI:10.1029/2012GL051037 |
| [] | 黄建斌, 王绍武, 龚道溢, 等. 2010. 近千年的大气涛动[J]. 科学通报, 55(22): 2469–2472. Huang Jianbin, Wang Shaowu, Gong Daoyi, et al. 2010. Atmospheric oscillations over the last millennium[J]. Chinese Science Bulletin, 55(22): 2469–2472. DOI:10.1007/s11434-010-3210-8 |
| [] | Huang P, Wang P F, Hu K M, et al. 2014. An introduction to the integrated climate model of the center for monsoon system research and its simulated influence of El Niño on East Asian-Western North Pacific climate[J]. Advances in Atmospheric Sciences, 31(5): 1136–1146. DOI:10.1007/s00376-014-3233-1 |
| [] | Huang S P. 2004. Merging information from different resources for new insights into climate change in the past and future[J]. Geophys. Res. Lett., 31(13): L13205. DOI:10.1029/2004GL019781 |
| [] | Jones P D, Briffa K R, Barnett T P, et al. 1998. High-resolution palaeoclimatic records for the last millennium:Interpretation, integration and comparison with general circulation model control-run temperatures[J]. Holocene, 8(4): 455–471. |
| [] | 况雪源, 刘健, 王红丽, 等. 2008. 近千年来南北半球气候变化模拟比较[J]. 科学通报, 53(17): 2692–2700. Kuang Xueyuan, Liu Jian, Wang Hongli, et al. 2008. Inter-hemispheric comparison of climate change in the last millennium based on the ECHO-G simulation[J]. Chinese Science Bulletin, 53(17): 2692–2700. DOI:10.1007/s11434-008-0193-9 |
| [] | Landrum L, Otto-Bliesner B L, Wahl E R, et al. 2013. Last millennium climate and its variability in CCSM4[J]. J. Climate, 26(4): 1085–1111. DOI:10.1175/JCLI-D-11-00326.1 |
| [] | Lee J Y, Wang B. 2014. Future change of global monsoon in the CMIP5[J]. Climate Dyn., 42(1-2): 101–119. DOI:10.1007/s00382-012-1564-0 |
| [] | Legutke S, Gayler V. 2005. The MPI-Met PRISM Earth System Model Adaptation Guide[R]. PRISM-Report Series-08. |
| [] | 李双林, 王彦明, 郜永祺. 2009. 北大西洋年代际振荡(AMO)气候影响的研究评述[J]. 大气科学学报, 32(3): 458–465. Li Shuanglin, Wang Yanming, Gao Yongqi. 2009. A review of the researches on the Atlantic Multidecadal Oscillation (AMO) and its climate influence[J]. Transactions of Atmospheric Sciences, 32(3): 458–465. |
| [] | Liu J, Wang B, Ding Q H, et al. 2009. Centennial variations of the global monsoon precipitation in the last millennium:Results from ECHO-G Model[J]. J. Climate, 22(9): 2356–2371. DOI:10.1175/2008JCLI2353.1 |
| [] | Liu J, Wang B, Wang H L, et al. 2011. Forced response of the East Asian summer rainfall over the past millennium:Results from a coupled model simulation[J]. Climate Dyn., 36(1-2): 323–336. DOI:10.1007/s00382-009-0693-6 |
| [] | Liu J, Wang B, Yim S Y, et al. 2012. What drives the global summer monsoon over the past millennium?[J]. Climate Dyn., 39(5): 1063–1072. DOI:10.1007/s00382-012-1360-x |
| [] | Luo J J, Masson S, Roeckner E, et al. 2005. Reducing climatology bias in an ocean-atmosphere CGCM with improved coupling physics[J]. J. Climate, 18(13): 2344–2360. DOI:10.1175/JCLI3404.1 |
| [] | MacDonald G M, Case R A. 2005. Variations in the Pacific Decadal Oscillation over the past millennium[J]. Geophys. Res. Lett., 32(8): L08703. DOI:10.1029/2005GL022478 |
| [] | Madec G. 2008. NEMO ocean engine[R]. Vol. 27, Institut Pierre-Simon Laplace, 193 pp. |
| [] | 满文敏, 周天军. 2011. 外强迫驱动下气候系统模式模拟的近千年大气涛动[J]. 科学通报, 56(28-29): 3042–3052. Man Wenmin, Zhou Tianjun. 2011. Forced response of atmospheric oscillations during the last millennium simulated by a climate system model[J]. Chinese Science Bulletin, 56(28-29): 3042–3052. DOI:10.1007/s11434-011-4637-2 |
| [] | Man W M, Zhou T J. 2014. Regional-scale surface air temperature and East Asian summer monsoon changes during the last millennium simulated by the FGOALS-gl climate system model[J]. Advances in Atmospheric Sciences, 31(4): 765–778. DOI:10.1007/s00376-013-3123-y |
| [] | Mann M E, Jones P D. 2003. Global surface temperatures over the past two millennia[J]. Geophys. Res. Lett., 30(15): 1820. DOI:10.1029/2003GL017814 |
| [] | Mann M E, Bradley R S, Hughes M K. 1999. Northern hemisphere temperatures during the past millennium:Inferences, uncertainties, and limitations[J]. Geophys. Res. Lett., 26(6): 759–762. DOI:10.1029/1999GL900070 |
| [] | Mann M E, Cane M A, Zebiak S E, et al. 2005. Volcanic and solar forcing of the tropical Pacific over the past 1000 years[J]. J. Climate, 18(3): 447–456. DOI:10.1175/JCLI-3276.1 |
| [] | Mann M E, Zhang Z, Hughes M K, et al. 2008. Proxy-based reconstructions of hemispheric and global surface temperature variations over the past two millennia[J]. Proceedings of the National Academy of Sciences of the United States of America, 105(36): 13252–13257. DOI:10.1073/pnas.0805721105 |
| [] | Mann M E, Zhang Z H, Rutherford S, et al. 2009. Global signatures and dynamical origins of the little ice age and medieval climate anomaly[J]. Science, 326(5957): 1256–1260. DOI:10.1126/science.1177303 |
| [] | Mantua N J, Hare S R, Zhang Y, et al. 1997. A Pacific interdecadal climate oscillation with impacts on salmon production[J]. Bull. Amer. Meteor. Soc., 78(6): 1069–1079. DOI:10.1175/1520-0477(1997)078<1069:APICOW>2.0.CO;2 |
| [] | Roeckner E, Bäuml G, Bonaventura L, et al. 2003. The atmospheric general circulation model ECHAM 5. PART1:Model description. Report 349[R]. Max Planck Institude for Meteorology:140. |
| [] | Rutherford S, Mann M E, Osborn T J, et al. 2005. Proxy-based Northern Hemisphere surface temperature reconstructions:Sensitivity to method, predictor network, target season, and target domain[J]. J. Climate, 18(13): 2308–2329. DOI:10.1175/JCLI3351.1 |
| [] | Schmidt G A, Jungclaus J H, Ammann C M, et al. 2012. Climate forcing reconstructions for use in PMIP simulations of the Last Millennium (v1. 1)[J]. Geoscientific Model Development, 5(1): 185–191. DOI:10.5194/gmd-5-185-2012 |
| [] | Servonnat J, Yiou P, Khodri M, et al. 2010. Influence of solar variability, CO2 and orbital forcing between 1000 and 1850 AD in the IPSLCM4 model[J]. Climate of the Past, 6(4): 445–460. DOI:10.5194/cp-6-445-2010 |
| [] | Trenberth K E, Stepaniak D P, Caron J M. 2000. The global monsoon as seen through the divergent atmospheric circulation[J]. J. Climate, 13(22): 3969–3993. DOI:10.1175/1520-0442(2000)013<3969:TGMAST>2.0.CO;2 |
| [] | Trouet V, Esper J, Graham N E, et al. 2009. Persistent positive North Atlantic Oscillation mode dominated the medieval climate anomaly[J]. Science, 324(5923): 78–80. DOI:10.1126/science.1166349 |
| [] | Valcke S. 2006. OASIS3 user guide[R]. Vol. 3, PRISM support initiative report, 64 pp. |
| [] | Vieira L E A, Solanki S K, Krivova N A, et al. 2011. Evolution of the solar irradiance during the Holocene[J]. Astronomy & Astrophysics, 531: A6. DOI:10.1051/0004-6361/201015843 |
| [] | Wang B, Ding Q H. 2006. Changes in global monsoon precipitation over the past 56 years[J]. Geophys. Res. Lett., 33(6): L06711. DOI:10.1029/2005GL025347 |
| [] | Wang B, Ding Q H. 2008. Global monsoon:Dominant mode of annual variation in the tropics[J]. Dyn. Atmos. Oceans, 44(3-4): 165–183. DOI:10.1016/j.dynatmoce.2007.05.002 |
| [] | Wang B, Kim H J, Kikuchi K, et al. 2011. Diagnostic metrics for evaluation of annual and diurnal cycles[J]. Climate Dyn., 37(5-6): 941–955. DOI:10.1007/s00382-010-0877-0 |
| [] | Wang P F. 2014. DIY the Integrated Climate Model and its computational performance[J]. Physics, arXiv:1405.7473. |
| [] | Wang Y M, Lean J L, Sheeley N R. 2005. Modeling the sun's magnetic field and irradiance since 1713[J]. The Astrophysical Journal, 625(1): 522–538. DOI:10.1086/429689 |
| [] | Xie P P, Arkin P A. 1997. Global precipitation:A 17-year monthly analysis based on gauge observations, satellite estimates, and numerical model outputs[J]. Bull. Amer. Meteor. Soc., 78: 2539–2558. DOI:10.1175/1520-0477(1997)078<2539:GPAYMA>2.0.CO;2 |
| [] | Zhou T J, Zhang L X, Li H M. 2008. Changes in global land monsoon area and total rainfall accumulation over the last half century[J]. Geophys. Res. Lett., 35(16): L16707. DOI:10.1029/2008GL034881 |
| [] | Zhou T J, Zhang X H, Yu Y Q, et al. 2000. The North Atlantic oscillation simulated by versions 2 and 4 of IAP/LASG GOALS Model[J]. Advances in Atmospheric Sciences, 17(4): 601–616. DOI:10.1007/s00376-000-0023-8 |
| [] | 周天军, 满文敏, 张洁. 2009. 过去千年气候变化的数值模拟研究进展[J]. 地球科学进展, 24(5): 469–476. Zhou Tianjun, Man Wenmin, Zhang Jie. 2009. Progress in numerical simulations of the climate over the last millennium[J]. Advances in Earth Science, 24(5): 469–476. |
| [] | 周天军, 李博, 满文敏, 等. 2011. 过去千年3个特征期气候的FGOALS耦合模式模拟[J]. 科学通报, 56(28-29): 3028–3041. Zhou Tianjun, Li Bo, Man Wenmin, et al. 2011. A comparison of the medieval warm period, little ice age and 20th century warming simulated by the FGOALS Climate System Model[J]. Chinese Science Bulletin, 56(28-29): 3028–3041. DOI:10.1007/s11434-011-4641-6 |
| [] | Zorita E, González-Rouco J F, von Storch H, et al. 2005. Natural and anthropogenic modes of surface temperature variations in the last thousand years[J]. Geophys. Res. Lett., 32(8): L08707. DOI:10.1029/2004GL021563 |
 2017, Vol. 22


