2 中国科学院大学地球与行星科学学院, 北京 100049
2 College of Earth and Planetary Sciences, University of Chinese Academy of Sciences, Beijing 100049
中亚地区位于亚欧大陆的腹地,气候干旱,水资源缺乏,受中纬度西风急流控制,地表覆盖变化十分剧烈,生态环境极其脆弱(杨恕和田宝,2002;Chen,2012;Wei et al., 2015;殷刚等,2017)。中亚地区是连接亚欧的桥梁,是古丝绸之路核心区域的重要组成部分,更是“一带一路”建设向西推进的必经之地(刘卫东,2015;陈发虎等,2017;郝志新等,2018)。中亚地区与中国贸易联系紧密,且潜力巨大(毕燕茹和师博,2010;崔登峰和邵伟,2017;苏丽娟和陈兴鹏,2017;闫杰等,2017;赵晓晓和彭世璞,2017)。
中亚地区温度年内变化范围大,年际变化显著,夏季炎热干燥,冬季寒冷。近几十年来,中亚地区地表温度增暖速率远大于全球平均,夏季高温增强(徐婷等,2015;张井勇等,2018)。夏季高温不仅影响社会生产,导致社会用电需求增大,农业畜牧业减产,还会影响人类身体健康,诱发心脏病、中风、中暑以及增加死亡率(黄朝迎,1999;杨太明和陈金华,2007;李立虎, 2014;Loughnan, 2014)。夏季高温伴随着水分蒸发量的增加,在降水量变化不大的情况下,会加剧干旱,进而加剧干旱区的水资源短缺与生态环境恶化(翟盘茂和邹旭恺,2005;Dai, 2011; Manatsa et al., 2017)。
准确的季节预测可以保护人民生命安全,保护农业生产活动,帮助进行水资源管理,帮助指导经济生活,减少经济损失。但是,之前很少有中亚地区夏季温度季节预测方面的研究。海表温度,陆面状况,大尺度气候指数是影响短期气候的重要因子(王会军等, 2002; 封国林等,2012;黄荣辉等,2013;张志森等,2015;陈文等,2018;钱卓蕾等,2018;吴楠等,2018;Zhang et al., 2018)。本文将从春季海表温度,春季土壤温度和春季大尺度气候指数出发,寻找中亚地区夏季温度的预测因子,进而建立季节预测模型。
2 资料与方法本研究中,中亚地区包括哈萨克斯坦、乌兹别克斯坦、土库曼斯坦、吉尔吉斯斯坦、塔吉克斯坦5个国家(图 1a)。夏季格点温度数据来自东安格利亚大学的气候研究部(CRU)的CRU TS4.01数据集(Harris et al., 2014),包括1979~2016年38年的月平均温度,空间分辨率为0.5°(纬度)×0.5°(经度);夏季站点温度数据来自全球历史气候观测网(GHCN)(Menne et al., 2012)。GHCN在中亚地区有日平均气温观测的站点有296个,选取1979~2016年每年夏季日平均温度缺测天数不多于5 d的站点为有效测站,中亚地区共筛选出36个,测站分布见图 1b。

|
图 1 中亚地区1979~2016年CRU格点数据(左列)和GHCN 36个有效站点数据(右列)夏季温度去趋势后EOF前三模态的空间分布 Fig. 1 Spatial patterns of the first three EOF modes of the detrended summer temperature from the CRU data (left panel) and 36 valid stations in GHCN (right panel) over Central Asia for the period of 1979−2016 |
春季海温数据来自哈德来中心海冰和海表温度数据集1.1版本Hadisst-v11(Rayner et al., 2003)。春季土壤温度数据分别来自由全球陆地数据同化系统(GLDAS)(Rodell et al., 2004) 1.0版本驱动的3个陆面模式:Noah(0.4~1 m土壤温度)、Mosaic(深层土壤温度)、CLM(0.28~1 m土壤温度)以及ERA-Interim再分析资料的0.83~1.38 m土壤温度(Berrisford et al., 2009)。春季大尺度气候指数包括中东部热带太平洋海温(East Central Tropical Pacific SST, Niño3.4)、东太平洋海温(Extreme Eastern Tropical Pacific SST, Niño1+2)、北大西洋涛动(North Atlantic Oscillation, NAO)指数、太平洋年代际涛动(Pacific Decadal Oscillation, PDO)指数、准两年振荡(Qusai-Biennial Oscillation, QBO)指数、大西洋多年代际振荡(Atlantic Multidecadal Oscillation Long Version, AMO)指数、北极涛动(Antarctic Oscillation, AO)指数、太平洋北美指数(Pacific North American Index, PNA)、大西洋经向模态(Atlantic Meridional Mode, AMM)指数、东亚/西俄型(Eastern Asia/Western Russia, EA/ WR)指数,均来自NOAA的地球系统研究实验室(ESRL)(http://www.esrl.noaa.gov/psd [2018-11-18])。以上春季数据均为月平均资料,时间跨度为1979~2016年,格点数据空间分辨率均为1°(纬度)×1°(经度)。夏季的500 hPa位势高度数据来自ERA- Interim,时间跨度为1979~2016年,空间分辨率均为0.5°(纬度)×0.5°(经度)。
本文首先使用经验正交函数(EOF)分解研究夏季中亚地区温度分布的时空特征和分析两套温度数据的异同。EOF分解是把包含p个空间点(变量)的场随时间变化进行分解,它可以用前几个分量的时间函数和空间函数来反映场的主要特征(黄嘉佑,2016)。然后本文用相关分析确定了中亚地区夏季温度预测的4个春季预测因子,之后用合成分析法研究4个春季预测因子正负异常状态对夏季中亚地区500 hPa位势高度场和地表气温的影响,接着用线性回归方法利用4个春季预测因子建立中亚地区夏季温度的预测模型。最后本文用留一交叉检验法检验预测模型预测性能的稳定性。文中涉及到的显著性检验是基于t检验。
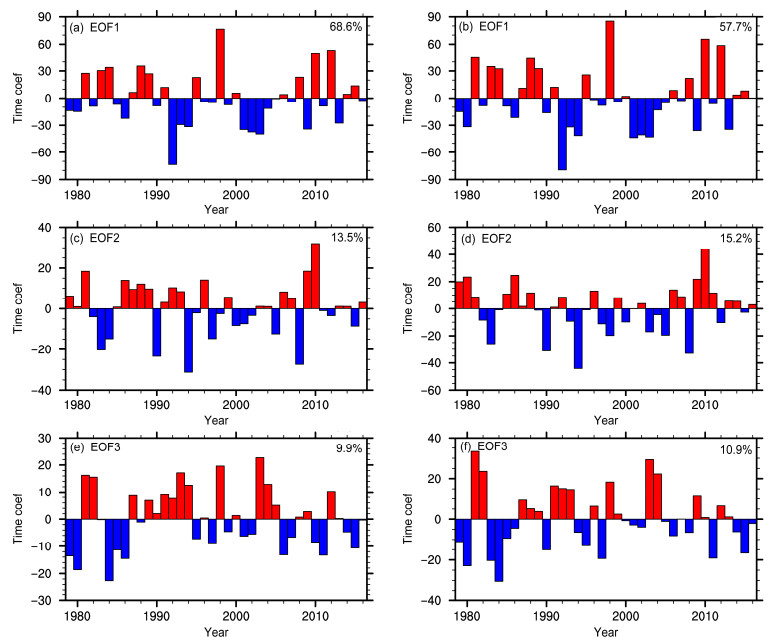
3 春季海表温度、土壤温度、大尺度气候指数与中亚地区夏季温度的关系图 1所示是中亚地区CRU格点数据和GHCN 36个有效站点数据1979~2016年夏季温度去趋势后EOF分析前三模态的空间分布。图 1a和1b分别展示了格点数据和站点数据的第一模态空间分布,两者具有相似性:中亚地区一致的变化形势,即中亚地区温度一致升高或降低。哈萨克斯坦的西北部为变化的大值区,由西北向东南变化逐渐减弱且第一模态为主导模态,方差贡献很大,分别为68.6%和57.7%。图 1c和1d展示了第二模态的空间分布:西部和东部反位相的变化形势,两套数据的变化中心略有差异,CRU格点数据变化中心分别位于中亚地区的西北部和东南部,GHCN站点数据变化中心位于中亚地区的西北部和东北部。图 1e和1f展示了第三模态的空间分布:南北反位相的变化形势,变化中心两套数据略有差异。图 2给出了CRU格点数据和GHCN站点数据前三模态对应的时间系数序列,两套数据时间系数序列具有很强的变化一致性,第一、第二和第三模态时间系数序列的相关分别为0.99、0.85、0.83。以上结果表明CRU格点数据和GHCN有效站点数据在分析中亚地区夏季温度特征规律方面具有很强的一致性,考虑到CRU温度格点数据的空间完整性,接下来的分析中中亚地区夏季温度数据均来自CRU TS4.01。中亚地区CRU夏季平均温度去趋势的时间序列与CRU数据EOF第一模态对应的时间系数序列的相关系数为0.98。
|
图 2 同图 1,但为前三模态对应的时间系数序列 Fig. 2 Same as Fig. 1, but for time coefficients series of the first three EOF modes |
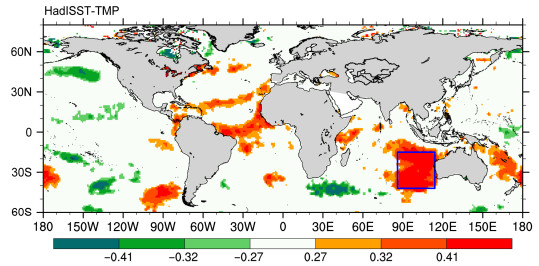
图 3所示是1979~2016年中亚地区夏季温度去趋势后的时间序列与前春去趋势后海表温度相关系数的空间分布情况。相关系数的大值区主要集中在印度洋东南部(15°S~42°S, 86°E~114°E),计算出1979~2016年此区域前春平均海表温度去趋势后时间序列与中亚地区夏季平均温度去趋势后的时间序列的相关为0.59,通过了99%信度检验,所以把去趋势后春季印度洋东南部平均海温确定为中亚地区夏季温度的预测因子。
|
图 3 1979~2016年中亚地区夏季平均温度去趋势时间序列与去趋势后春季海表温度相关系数的空间分布。±0.27、±0.32、±0.41是达到90%、95%和99%信度检验的相关系数值。蓝色框所示区域——印度洋东南部(15°S~42°S, 86°E~114°E)是春季海表温度的关键区域 Fig. 3 Distribution of correlation coefficients between the detrended time series of summer temperature averaged over Central Asia and detrended spring sea surface temperature for the period of 1979−2016. Correlations of ±0.27, ±0.32, and ±0.41 are significantat the 90%, 95%, and 99% levels, respectively. The area enclosed by the blue box indicates the southeastern Indian Ocean (15°S−42°S, 86°E−114°E), which is a key region of the spring sea surface temperature |
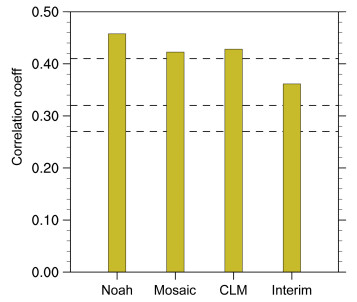
图 4所示中亚地区夏季温度去趋势后时间序列与来自4个不同数据集的前春去趋势后土壤温度的相关系数分布情况。相关系数在非洲西北部(11°N~25°N, 9°W~16°W)表现出了一致的大值区。来自GLDAS-Noah、GLDAS-Mosaic、GLDAS- CLM、ERA-Interim的非洲西北部前春平均土壤温度去趋势后时间序列与中亚地区夏季平均温度去趋势后时间序列的相关系数分别为0.46、0.42、0.43、0.36,前三个相关系数超过了99%信度检验,第4个相关系数超过了95%信度检验(如图 5所示)。由于中亚地区夏季温度与GLDAS-Noah的春季土壤温度有着最高的相关系数0.46,所以把GLDAS- Noah去趋势后的春季非洲西北部的平均土壤温度确定为中亚地区夏季温度的预测因子。

|
图 4 1979~2016年中亚地区夏季平均温度去趋势时间序列与去趋势后春季土壤温度相关系数的空间分布。土壤温度分别来自GLDAS-Noah、GLDASMosaic、GLDAS-CLM和ERA-Interim数据集。±0.27、±0.32、±0.41是达到90%、95%和99%信度检验的相关系数值。蓝色框所示区域——非洲西北部(11°N~25°N, 9°W~16°W)是春季土壤温度的关键区域 Fig. 4 Distributions of correlation coefficients between the detrended time series of summer temperature averaged over Central Asia and detrended spring soil temperature for the period of 1979−2016. The soil temperature data are from GLDAS-Noah, GLDAS-Mosaic, GLDAS-CLM, and ERA-Interim datasets. Correlations of ±0.27, ±0.32, and ±0.41 are significant at the 90%, 95%, and 99% confidence levels, respectively. The area enclosed by blue box indicates northwest Africa (11°N−25°N, 9°W−16°W), which is a key region of the spring soil temperature |
|
图 5 来自GLDAS-Noah、GLDAS-Mosaic、GLDAS-CLM、ERA-Interim 4个不同数据集的1979~2016年春季非洲西北部的平均土壤温度的去趋势时间序列与中亚地区夏季平均温度去趋势时间序列的相关系数。±0.27、±0.32、±0.41分别为达到90%、95%和99%信度检验的相关系数值 Fig. 5 Correlation coefficients between the detended time series of summer temperature averaged over Central Asia and detrended time series of spring soil temperature from the GLDAS-Noah, GLDAS-Mosaic, GLDAS-CLM, and ERA-Interim datasets averaged over northwest Africa for the period of 1979−2016. Correlations of ±0.27, ±0.32, and ±0.41 indicate significance at the 90%, 95%, and 99% confidence levels, respectively |
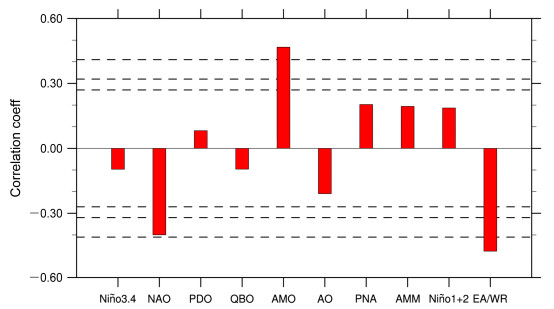
图 6所示是1979~2016年中亚地区夏季温度去趋势后的时间序列与前春去趋势后大尺度气候指数的相关系数,其中与AMO、EA/WR的相关系数分别为0.47、-0.47,通过了99%信度检验,所以把春季去趋势的AMO、EA/WR两个大尺度气候指数确定为中亚地区夏季温度的预测因子。
|
图 6 1979~2016年春季大尺度指数(Niño3.4、NAO、PDO、QBO、AMO、AO、PNA、AMM、Niño1+2,EA/WR)的去趋势时间序列与夏季中亚地区平均温度的去趋势时间序列的相关系数。±0.27、±0.32、±0.41是达到90%、95%和99%信度检验的相关系数值 Fig. 6 Correlation coefficients between the detrended time series of spring climate indexes (Niño3.4, NAO, PDO, QBO, AMO, AO, PNA, AMM, Niño1+2, and EA/WR) and detended time series of summer temperature averaged over Central Asia for the period of 1979−2016. Correlations of ±0.27, ±0.32, and ±0.41 indicate significance at the 90%, 95%, and 99% confidence levels, respectively |
观测资料和模式结果一致表明印度洋海温异常可以对亚洲气候产生重要影响(肖子牛等,2000;Yang et al., 2007)。研究表明亚洲夏季气候更易受南半球印度洋海温影响,尤其是印度洋东南部海温,冬季印度洋东南部海温是夏季印度季风的重要预测信号之一(Terray et al., 2003, 2005; Yoo et al., 2006)。研究表明,陆面信息是季节预测的重要因子(Koster et al., 2004; 张井勇和吴凌云,2014;Yang et al., 2018; Zhang et al., 2018)。土壤温度具有几个月的记忆长度,可以通过影响地表能量和水分平衡影响局地气候,还可以通过激发Rossbey波的方式影响其他区域的气候(Wu and Zhang, 2015; Xue et al., 2018)。之前的研究表明,AMO与亚洲气候联系紧密,它可以通过影响西太平洋的海气反馈,影响欧亚对流层气温变化以及通过欧亚对流层中高层的加热等机制来影响亚洲气候,AMO正位相时,对应亚欧大陆大部分地区的增暖(Lu et al., 2006; Li and Bates, 2007; Wang et al., 2009)。EA/WR是全年影响亚欧大陆气候的三大遥相关之一,它的正位相对应2个位势高度正异常中心:欧洲和中国北部;2个负异常中心:北美中部和里海北部(Barnston and Livezey, 1987)。EA/WR像行星尺度静止波列一样不仅可以影响地中海区域气候还可以影响中东地区、中亚地区以及东亚地区气候(Krichak et al., 2002, 2014; Lim, 2015)。
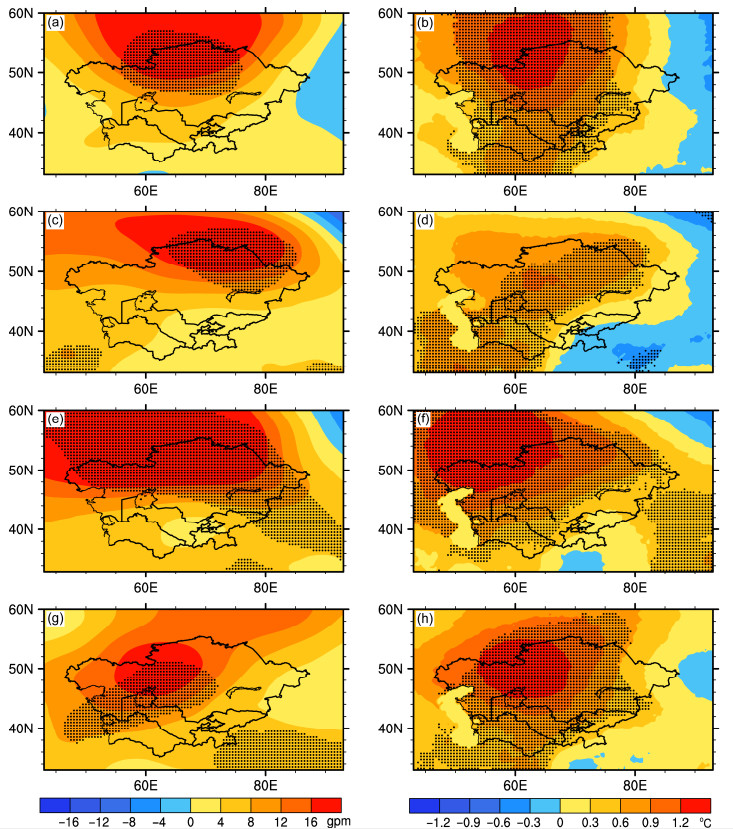
本文分别用4个春季预测因子:印度洋东南部海温、非州西北部土壤温度、AMO、EA/WR在1979~2016年最大(小)的10年与最小(大)的10年合成夏季去趋势后500 hPa位势高度场和地表气温来尝试解释春季的预测因子如何影响夏季中亚地区的温度。图 7a和7b给出了1979~2016年去趋势后春季印度洋东南部海表温度最热的10年与最冷的10年合成去趋势后夏季500 hPa位势高度场和地表气温场。在整个中亚地区都呈现出正的位势高度差值场,且差值场大值区位于中亚地区的北部,自中亚地区的北部向四周辐射减少,在哈萨克斯坦的北部差值场通过了90%信度检验,对应于地表气温在中亚区域绝大部分都是正的差值场,差值场大值区也位于哈萨克斯坦北部,且在大部分中亚区域差值通过了90%信度检验。图 7c和7d给出了1979~2016年去趋势后春季非洲西北部土壤温度最热的10年与最冷的10年合成去趋势后夏季500 hPa位势高度场和地表气温场。在整个中亚区域都是正的位势高度差值场,哈萨克斯坦东部部分区域通过了90%信度检验,对应于地表气温,绝大部分中亚区域都是正的差值场,哈萨克斯坦、乌兹别克斯坦和土库曼斯坦的部分区域通过了90%信度检验。图 7e和7f给出了1979~2016年去趋势后春季AMO最大的10年与最小的10年合成去趋势后夏季500 hPa位势高度场和地表气温场。在整个中亚地区都是正的位势高度差值场和正的地表气温差值场,位势高度差异值在哈萨克斯坦的绝大部分区域通过了90%信度检验,地表气温差异值在中亚区域的绝大部分通过了90%信度检验。图 7g和7h给出了1979~2016年去趋势后春季EA/WR最小的10年与最大的10年合成去趋势后夏季500 hPa位势高度场和地表气温场。在整个中亚区域都是正的位势高度差值场和正的地表气温差异场,且差异场的大值区都位于哈萨克斯坦的东部区域。位势高度差异值在哈萨克斯坦西南的部分区域以及乌兹别克斯坦和土库曼斯坦西北部的部分区域通过了90%信度检验,地表气温差异值在绝大部分中亚区域通过了90%信度检验。
|
图 7 1979~2016年去趋势后(a、b)印度洋东南部春季海表温度最热的10年与最冷的10年、(c、d)非洲西北部春季土壤温度最热的10年与最冷的10年、(e、f)AMO最大的10年与最小的10年、(g、h)EA/WR最小的10年与最大的10年合成的去趋势后夏季500 hPa位势高度场(左列)和地表气温场(右列)。带点区代表合成场通过90%信度检验 Fig. 7 Composite analysis of detrended summer 500-hPa geopotential height (left panel) and surface air temperature (right panel) between (a, b) the warmest 10 years and the coldest 10 years of detrended spring sea surface temperature averaged over the southeastern Indian Ocean, (c, d) the warmest 10 years and the coldest 10 years of detrended spring soil temperature averaged over Northwest Africa, (e, f) the largest 10 years and the smallest 10 years of detrended AMO, (g, h) the smallest 10 years and the largest 10 years of detrended EA/WR. Areas with dots represent that the composite values are significant at the 90% confidence level |
总结而言,春季印度洋东南部海温暖异常,春季非洲西北部土壤温度暖异常,春季AMO正异常,春季EA/WR负异常均对应夏季中亚地区位势高度的正异常。更高的位势高度能够通过下沉增温、辐射增强、降水减少等过程加热地表大气,进而导致中亚地区夏季地表气温的正异常,反之亦然。
4 中亚地区夏季平均温度季节预测模型的建立及检验用1979~2016年春季印度洋东南部平均海表温度、非洲西北部平均土壤温度、AMO、EA/WR 4个预测因子的去趋势时间序列建立1979~2016年中亚地区夏季温度去趋势时间序列的线性回归方程:
| $ \begin{array}{l} {Y_{\rm{d}}} = 0.15 \times {T_{{\rm{sd}}}} + 0.69 \times {T_{{\rm{ssd}}}} + 1.29 \times {I_{{\rm{AMOd}}}} - \\ \;\;\;\;\;\;\;0.28 \times {I_{{\rm{EA/WRd}}}}, \end{array} $ | (1) |
其中,Yd是预测的去趋势后夏季中亚地区平均温度;Tsd是去趋势后春季非洲西北部平均土壤温度;Tssd是去趋势后春季印度洋东南部平均海温;IAMOd是去趋势后春季AMO指数;IEA/WRd是去趋势后春季EA/WR指数。
此回归方程在0.01水平上具有显著性,复相关系数为0.73,可以解释去趋势后夏季中亚地区平均温度53%的方差。在得到的回归方程的基础上加上中亚地区夏季温度的趋势项即为中亚地区夏季平均温度的预测模型:
| $ \mathit{Y} = {Y_{\rm{d}}} + {Y_{{\rm{trend}}}}, $ | (2) |
| $ {Y_{{\rm{trend}}}} = 22.22 + 0.029 \times \left({{I_{{\rm{year}}}} - 1979} \right), $ | (3) |
其中,Y是预测的夏季中亚地区平均温度;Ytrend是观测的夏季中亚地区平均温度的趋势项,Iyear表示年份。
接着,用留一法交叉检验的方法检验回归方程的稳定性——1979~2016年38年每年的预测量均为剩余37年的数据序列建立的回归方程计算得出。图 8a为1979~2016年观测的中亚地区夏季温度去趋势时间序列与留一法交叉检验得到的时间序列,两者的相关系数为0.65;图 8b为1979~2016年观测的中亚地区夏季温度原始时间序列与留一法交叉检验得到的预测量加上中亚地区温度趋势项后的时间序列,两者的相关系数为0.74。可以看出,本文建立的中亚地区夏季温度预测模型是有效、可信,且稳定的。

|
图 8 1979~2016年观测和预测的中亚地区夏季平均温度(a)去趋势后和(b)加上趋势后的时间序列 Fig. 8 Time series of observed and predicted summer temperature averaged over Central Asia (a) detrended and (b) added the trend for the period of 1979−2016 |
中亚地区位于中纬度内陆地区,生态环境脆弱,在“一带一路”建设不断推进的背景下,中亚地区吸引着越来越多的学者的关注。本文从春季海表温度、土壤温度、大尺度气候指数出发,寻找中亚地区夏季温度的预测因子。春季印度洋东南部海表温度、非洲西北部土壤温度、AMO、EA/WR与中亚地区夏季温度关系紧密,去趋势后相关系数分别为0.59、0.46、0.47和-0.47,显著性检验表明4个相关系数均通过了99%信度检验,进一步被确定为预测因子。通过合成分析发现春季印度洋东南部海表温度暖异常、非洲西北部土壤温度暖异常、AMO的正异常与EA/WR的负异常均对应夏季中亚地区500 hPa高位势高度场,从而通过辐射增温、下沉增温、降水减少等过程加热地表大气,使中亚地区夏季温度升高。利用4个预测因子和中亚地区夏季温度趋势项建立中亚地区夏季温度的预测模型。预测模型留一法交叉检验产生的1979~2016年中亚地区夏季温度无(有)趋势的时间序列与观测无(有)趋势的时间序列相关系数为0.65(0.74)。本文建立的预测模型简单、有效、稳定,便于应用于实际预测工作。本文存在一些不足之处。文中所述4个春季预测因子与中亚地区夏季温度的物理过程连接还需进一步研究;本文建立的预测模型为线性模型,将来的研究需要更好地考虑非线性过程的影响。
| [] | Barnston A G, Livezey R E. 1987. Classification, seasonality and persistence of low-frequency atmospheric circulation patterns[J]. Mon.Wea. Rev., 115(6): 1083–1126. DOI:10.1175/1520-0493(1987)115<1083:CSAPOL>2.0.CO;2 |
| [] | Berrisford P, Dee D, Fielding K, et al. 2009. The ERA-Interim archive[R]. ECMWF, ERA Report Series 1, 16pp. |
| [] | 毕燕茹, 师博. 2010. 中国与中亚五国贸易潜力测算及分析——贸易互补性指数与引力模型研究[J]. 亚太经济(3): 47–51. Bi Yanru, Shi Bo. 2010. The analysis and testing of trade potentialities between China and Central Asia Counties:Empirical study by RCA and Trade Gravity Model[J]. Asia-Pacific Economic Review (in Chinese) (in Chinese)(3): 47–51. DOI:10.16407/j.cnki.1000-6052.2010.03.019 |
| [] | Chen F H. 2012. A discussion on the westerly-dominated climate model in mid-latitude Asia during the modern interglacial period[J]. Quaternary International, 279-280: 86–87. DOI:10.1016/j.quaint.2012.07.381 |
| [] | 陈发虎, 安成邦, 董广辉, 等. 2017. 丝绸之路与泛第三极地区人类活动、环境变化和丝路文明兴衰[J]. 中国科学院院刊, 32(9): 967–975. Chen Fahu, An Chengbang, Dong Guanghui, et al. 2017. Human activities, environmental changes, and rise and decline of Silk Road Civilization in Pan-Third Pole Region[J]. Bulletin of Chinese Academy of Sciences (in Chinese), 32(9): 967–975. DOI:10.16418/j.issn.1000-3045.2017.09.006 |
| [] | 陈文, 丁硕毅, 冯娟, 等. 2018. 不同类型ENSO对东亚季风的影响和机理研究进展[J]. 大气科学, 42(3): 640–655. Chen Wen, Ding Shuoyi, Feng Juan, et al. 2018. Progress in the study of impacts of different types of ENSO on the East Asian monsoon and their mechanisms[J]. Chinese Journal of Atmospheric Sciences (in Chinese) (in Chinese), 42(3): 640–655. DOI:10.3878/j.issn.1006-9895.1801.17248 |
| [] | 崔登峰, 邵伟. 2017. 中国与中亚五国贸易竞争性、互补性和出口潜力研究[J]. 商业研究(3): 93–101. Cui Dengfeng, Shao Wei. 2017. A study of trade competitiveness, trade complementarity and export trade potential between China and Central Asia Countries[J]. Commercial Research (in Chinese) (in Chinese)(3): 93–101. DOI:10.13902/j.cnki.syyj.2017.03.013 |
| [] | Dai A G. 2011. Drought under global warming:A review[J]. Wiley Interdisciplinary Reviews-Climate Change, 2(1): 45–65. DOI:10.1002/wcc.81 |
| [] | 封国林, 杨涵洧, 张世轩, 等. 2012. 2011年春末夏初长江中下游地区旱涝急转成因初探[J]. 大气科学, 36(5): 1009–1026. Feng Guolin, Yang Hanwei, Zhang Shixuan, et al. 2012. A preliminary research on the reason of a sharp turn from drought to flood in the middle and lower reaches of the Yangtze River in late spring and early summer of 2011[J]. Chinese Journal of Atmospheric Sciences (in Chinese) (in Chinese), 36(5): 1009–1026. DOI:10.3878/j.issn.1006-9895.2012.11220 |
| [] | 郝志新, 梁亚妮, 刘洋, 等. 2018. 古丝绸之路沿线地区千年冷暖变化的若干特征[J]. 地理科学进展, 37(4): 485–494. Hao Zhixin, Liang Yani, Liu Yang, et al. 2018. Characteristics of temperature changes during the past millennium along the Ancient Silk Road[J]. Progress in Geography (in Chinese) (in Chinese), 37(4): 485–494. DOI:10.18306/dlkxjz.2018.04.004 |
| [] | Harris I, Jones P D, Osborn T J, et al. 2014. Updated high-resolution grids of monthly climatic observations-The CRU TS3.10 Dataset[J]. International Journal of Climatology, 34(3): 623–642. DOI:10.1002/joc.3711 |
| [] | 黄朝迎. 1999. 北京地区1997年夏季高温及其对供电系统的影响[J]. 气象, 25(1): 20–24. Huang Chaoying. 1999. High temperature and its impact on electric supply system in Beijing in 1997's summer[J]. Meteorological Monthly (in Chinese) (in Chinese), 25(1): 20–24. DOI:10.7519/j.issn.1000-0526.1999.1.004 |
| [] | 黄嘉佑. 2016. 气象统计分析与预报方法(4版)[M]. 北京: 气象出版社: 304pp. Huang Jiayou. 2016. Meteorological Statistical Analysis and Forecasting Method (4th ed) (in Chinese) (in Chinese)[M]. Beijing: China Meteorological Press: 304pp. |
| [] | 黄荣辉, 周德刚, 陈文, 等. 2013. 关于中国西北干旱区陆-气相互作用及其对气候影响研究的最近进展[J]. 大气科学, 37(2): 189–210. Huang Ronghui, Zhou Degang, Chen Wen, et al. 2013. Recent progress in studies of air-land interaction over the arid area of Northwest China and its impact on climate[J]. Chinese Journal of Atmospheric Sciences (in Chinese) (in Chinese), 37(2): 189–210. DOI:10.3878/j.issn.1006-9895.2012.12303 |
| [] | Koster R D, Dirmeyer P A, Guo Z C, et al. 2004. Regions of strong coupling between soil moisture and precipitation[J]. Science, 305(5687): 1138–1140. DOI:10.1126/science.1100217 |
| [] | Krichak S O, Breitgand J S, Gualdi S, et al. 2014. Teleconnection-extreme precipitation relationships over the Mediterranean region[J]. Theor. Appl. Climatol., 117(3-4): 679–692. DOI:10.1007/s00704-013-1036-4 |
| [] | Krichak S O, Kishcha P, Alpert P. 2002. Decadal trends of main Eurasian oscillations and the Eastern Mediterranean precipitation[J]. Theor. Appl. Climatol., 72(3-4): 209–220. DOI:10.1007/s007040200021 |
| [] | 李立虎. 2014. 安徽地区夏季高温天气对养猪业的影响及其应对措施[J]. 农业灾害研究, 4(10): 42–47. Li Lihu. 2014. Impact of hot weather in summer on swine industry in Anhui and its response measures[J]. Journal of Agricultural Catastrophology (in Chinese) (in Chinese), 4(10): 42–47. DOI:10.19383/j.cnki.nyzhyj.2014.10.008 |
| [] | Li S L, Bates G T. 2007. Influence of the Atlantic multidecadal oscillation on the winter climate of East China[J]. Advances in Atmospheric Sciences, 24(1): 126–135. DOI:10.1007/s00376-007-0126-6 |
| [] | Lim Y K. 2015. The East Atlantic/West Russia (EA/WR) teleconnection in the North Atlantic:Climate impact and relation to Rossby wave propagation[J]. Climate Dyn., 44(11-12): 3211–3222. DOI:10.1007/s00382-014-2381-4 |
| [] | 刘卫东. 2015. "一带一路"战略的科学内涵与科学问题[J]. 地理科学进展, 34(5): 538–544. Liu Weidong. 2015. Scientific understanding of the Belt and Road Initiative of China and related research themes[J]. Progress in Geography (in Chinese) (in Chinese), 34(5): 538–544. |
| [] | Loughnan M. 2014. Heatwaves are silent killers[J]. Geodate, 27(1): 7. |
| [] | Lu R Y, Dong B W, Ding H. 2006. Impact of the Atlantic Multidecadal Oscillation on the Asian summer monsoon[J]. Geophysical Research Letters, 33(24): L24701. DOI:10.1029/2006GL027655 |
| [] | Manatsa D, Mushore T, Lenouo A. 2017. Improved predictability of droughts over southern Africa using the standardized precipitation evapotranspiration index and ENSO[J]. Theor. Appl. Climatol., 127(1-2): 259–274. DOI:10.1007/s00704-015-1632-6 |
| [] | Menne M J, Durre I, Vose R S, et al. 2012. An overview of the global historical climatology network-daily database[J]. J. Atmos. Oceanic Technol., 29(7): 897–910. DOI:10.1175/JTECH-D-11-00103.1 |
| [] | 钱卓蕾, 娄小芬, 马洁华, 等. 2018. 2014年夏季浙江低温多雨的大尺度环流特征及与海温异常关系[J]. 气候与环境研究, 23(2): 199–209. Qian Zhuolei, Lou Xiaofen, Ma Jiehua, et al. 2018. Large-scale circulation characteristics corresponding to the cold and rainy summer of 2014 in Zhejiang Province and the relationship with SST anomalies[J]. Climatic and Environmental Research (in Chinese) (in Chinese), 23(2): 199–209. DOI:10.3878/j.issn.1006-9585.2017.17012 |
| [] | Rayner N A, Parker D E, Horton E B, et al. 2003. Global analyses of sea surface temperature, sea ice, and night marine air temperature since the late nineteenth century[J]. J. Geophys. Res., 108(D14): 4407. DOI:10.1029/2002JD002670 |
| [] | Rodell M, Houser P R, Jambor U, et al. 2004. The global land data assimilation system[J]. Bull. Amer. Meteor. Soc., 85(3): 381–394. DOI:10.1175/BAMS-85-3-381 |
| [] | 苏丽娟, 陈兴鹏. 2017. 丝绸之路经济带背景下贸易一体化与经济增长研究——基于中国与中亚五国的数据[J]. 兰州大学学报, 45(1): 137–144. Su Lijuan, Chen Xingpeng. 2017. A study of trade integration and economic growth in the strategic background of the Silk Road Economic Belt[J]. Journal of Lanzhou University (Social Sciences) (in Chinese) (in Chinese), 45(1): 137–144. |
| [] | Terray P, Delecluse P, Labattu S, et al. 2003. Sea surface temperature associations with the late Indian summer monsoon[J]. Climate Dyn., 21(7-8): 593–618. DOI:10.1007/s00382-003-0354-0 |
| [] | Terray P, Dominiak S, Delecluse P. 2005. Role of the southern Indian Ocean in the transitions of the monsoon-ENSO system during recent decades[J]. Climate Dyn., 24(2-3): 169–195. DOI:10.1007/s00382-004-0480-3 |
| [] | 王会军, 周广庆, 林朝晖. 2002. 我国近年来短期气候预测研究的若干进展[J]. 气候与环境研究, 7(2): 220–226. Wang Huijun, Zhou Guangqing, Lin Zhaohui. 2002. Reviews on study of the short-term climate prediction in China[J]. Climatic and Environmental Research (in Chinese) (in Chinese), 7(2): 220–226. DOI:10.3969/j.issn.1006-9585.2002.02.009 |
| [] | Wang Y M, Li S L, Luo D H. 2009. Seasonal response of Asian monsoonal climate to the Atlantic multidecadal oscillation[J]. J. Geophys. Res., 114(D2): D02112. DOI:10.1029/2008JD010929 |
| [] | Wei H, Chen J H, Zhang X J, et al. 2015. Definition of the core zone of the "westerlies-dominated climatic regime", and its controlling factors during the instrumental period[J]. Science China Earth Sciences, 58(5): 676–684. DOI:10.1007/s11430-015-5057-y |
| [] | Wu L Y, Zhang J Y. 2015. Strong subsurface soil temperature feedbacks on summer climate variability over the arid/semi-arid regions of East Asia[J]. Atmospheric Science Letters, 15(4): 307–313. DOI:10.1002/asl2.504 |
| [] | 吴楠, 李丽平, 李双林, 等. 2018. 与印度洋偶极子模态有关的西太平洋海温异常型及其对东亚冬季气候的影响[J]. 气候与环境研究, 23(4): 387–400. Wu Nan, Li Liping, Li Shuanglin, et al. 2018. Winter SST variation patterns in the subtropical Western Pacific associated with Indian Ocean dipole and their influences on East Asian winter climate[J]. Climatic and Environmental Research (in Chinese) (in Chinese), 23(4): 387–400. DOI:10.3878/j.issn.1006-9585.2017.17022 |
| [] | 肖子牛, 孙绩华, 李崇银. 2000. El Ni o期间印度洋海温异常对亚洲气候的影响[J]. 大气科学, 24(4): 461–469. Xiao Ziniu, Sun Jihua, Li Chongyin. 2000. Influence of the Indian Ocean SSTA on Asian climate during an ENSO period[J]. Chinese Journal of Atmospheric Sciences (in Chinese) (in Chinese), 24(4): 461–469. DOI:10.3878/j.issn.1006-9895.2000.04.03 |
| [] | 徐婷, 邵华, 张弛. 2015. 近32a中亚地区气温时空格局分析[J]. 干旱区地理, 38(1): 25–35. Xu Ting, Shao Hua, Zhang Chi. 2015. Temporal pattern analysis of air temperature change in Central Asia during 1980-2011[J]. Arid Land Geography (in Chinese) (in Chinese), 38(1): 25–35. DOI:10.13826/j.cnki.cn65-1103/x.2015.01.004 |
| [] | Xue Y K, Diallo I, LiW K, et al. 2018. Spring land surface and subsurface temperature anomalies and subsequent down stream late spring-summer droughts/floods in North America and East Asia[J]. J. Geophys. Res., 123(10): 5001–5019. DOI:10.1029/2017JD028246 |
| [] | 闫杰, 刘清娟, 热依汗吾甫尔. 2017. 中国对中亚五国直接投资的贸易效应——基于丝绸之路经济带视角的研究[J]. 上海经济研究(3): 58–64. Yan Jie, Liu Qingjuan, Reyihan W. 2017. On the trade effect of Chinese outward foreign direct investment in Central Asia Countries:In the view of the silk road economic belt[J]. Shanghai Journal of Economics (in Chinese) (in Chinese)(3): 58–64. DOI:10.19626/j.cnki.cn31-1163/f.2017.03.007 |
| [] | Yang J L, Liu Q Y, Xie S P, et al. 2007. Impact of the Indian Ocean SST basin mode on the Asian summer monsoon[J]. Geophys. Res. Lett., 34(2): L02708. DOI:10.1029/2006GL028571 |
| [] | Yang K, Zhang J Y, Wu L Y, et al. 2018. Prediction of summer hot extremes over the middle and lower reaches of the Yangtze River valley[J]. Climate Dyn. DOI:10.1007/s00382-018-4302-4 |
| [] | 杨恕, 田宝. 2002. 中亚地区生态环境问题述评[J]. 东欧中亚研究(5): 51–55. Yang Shu, Tian Bao. 2002. Comments on Central Asian ecological environment[J]. East European, Russian & Central Asian Studies (in Chinese) (in Chinese)(5): 51–55. DOI:10.3969/j.issn.1671-8461.2002.05.009 |
| [] | 杨太明, 陈金华. 2007. 江淮之间夏季高温热害对水稻生长的影响[J]. 安徽农业科学, 35(27): 8530–8531. Yang Taiming, Chen Jinhua. 2007. Effects of hot disaster of high temperature in summer on rice growth in central Anhui[J]. Journal of Anhui Agri. Sci. (in Chinese) (in Chinese), 35(27): 8530–8531. DOI:10.3969/j.issn.0517-6611.2007.27.066 |
| [] | 殷刚, 孟现勇, 王浩, 等. 2017. 1982~2012年中亚地区植被时空变化特征及其与气候变化的相关分析[J]. 生态学报, 37(9): 3149–3163. Yin Gang, Meng Xianyong, Wang Hao, et al. 2017. Spatial-temporal variation of vegetation and its correlation with climate change in Central Asia during the period of 1982-2012[J]. Acta Ecologica Sinica (in Chinese) (in Chinese), 37(9): 3149–3163. DOI:10.5846/stxb201601240164 |
| [] | Yoo S H, Yang S, Ho C H. 2006. Variability of the Indian Ocean sea surface temperature and its impacts on Asian-Australian monsoon climate[J]. J. Geophys. Res., 111(D3): D03108. DOI:10.1029/2005JD006001 |
| [] | 翟盘茂, 邹旭恺. 2005. 1951~2003年中国气温和降水变化及其对干旱的影响[J]. 气候变化研究进展, 1(1): 16–18. Zhai Panmao, Zou Xukai. 2005. Changes in temperature and precipitation and their impacts on drought in China during 1951-2003[J]. Advances in Climate Change Research (in Chinese) (in Chinese), 1(1): 16–18. DOI:10.3969/j.issn.1673-1719.2005.01.004 |
| [] | Zhang J Y, Yang Z M, Wu L Y. 2018. Skillful prediction of hot temperature extremes over thesource region of ancient Silk Road[J]. Scientific Reports, 8(1): 6677. DOI:10.1038/s41598-018-25063-x |
| [] | 张井勇, 吴凌云. 2014. 陆-气相互作用对东亚气候的影响[M]. 北京: 气象出版社: 138pp. Zhang Jingyong, Wu Lingyun. 2014. Impacts of Land-Atmosphere Interactions on Climate over East Asia (in Chinese) (in Chinese)[M]. Beijing: China Meteorological Press: 138pp. |
| [] | 张井勇, 庄园煌, 李超凡, 等. 2018. "一带一路"主要地区气候变化与极端事件时空特征研究[M]. 北京: 气象出版社: 178pp. Zhang Jingyong, Zhuang Yuanhuang, Li Chaofan, et al. 2018. Temporal and Spatial Analyses of Climate Change and Extreme Events over Major Areas of the Belt and Road (in Chinese) (in Chinese)[M]. Beijing: China Meteorological Press: 178pp. |
| [] | 张志森, 龚志强, 叶天舒, 等. 2015. 热带印度洋与全球大气相互作用的信息传输特征分析[J]. 大气科学, 39(3): 461–473. Zhang Zhisen, Gong Zhiqiang, Ye Tianshu, et al. 2015. Characteristics of information transfer of interaction between the tropical Indian Ocean and global atmosphere[J]. Chinese Journal of Atmospheric Sciences (in Chinese) (in Chinese), 39(3): 461–473. DOI:10.3878/j.issn.1006-9895.1408.13334 |
| [] | 赵晓晓, 彭世璞. 2017. 中国与中亚五国贸易格局的时间维度分析——基于"丝绸之路经济带"背景[J]. 价格月刊(2): 47–52. Zhao Xiaoxiao, Peng Shipu. 2017. An analysis of time dimension of trade pattern between China and Stans——Based on the background of "Silk Road Economic Belt"[J]. Prices Monthly (in Chinese) (in Chinese)(2): 47–52. DOI:10.14076/j.issn.1006-2025.2017.02.12 |
 2019, Vol. 24

